AssignmentGPT Blogs
Flowcharts are everywhere. They pop up in corporate boardrooms, classrooms, and even living rooms when you’re trying to figure out who does the dishes next. They help us see processes clearly. You’ve probably sketched one on a napkin at some point, trying to map out a morning routine or a business workflow. It’s that universal. But what makes these diagrams so appealing? Maybe it’s the simplicity of seeing each step in a neat shape or the thrill of connecting boxes with arrows. Whatever the reason, flowcharts let us visualize an entire process without losing our marbles.
If you’ve ever felt overwhelmed by a messy procedure or a tangled web of decision points, take heart. Flowcharts are here to save the day. They transform chaos into clarity, letting you see where you start, what choices you face, and how to reach the end. In this post, we’ll explore the power of flowcharts, break down sixteen different types, and show you examples of flow diagrams that can simplify just about anything. We’ll also take a quick peek at how AssignmentGPT AI can help you build these diagrams faster than you can say “flow chart.” Grab a coffee, sit back, and prepare to geek out over shapes and arrows.
Quick Summary
In a rush? Here’s the skinny. Flowcharts are diagrams that use boxes, arrows, and symbols to map out processes. They’re crucial for explaining how things work or how decisions are made. You can find all sorts of types of flowcharts, from standard process flows to specialized diagrams for software code. Each type suits a unique purpose, whether it’s guiding users through a website or detailing an entire production line. If you want to skip manual drawing and dive straight into automation, AssignmentGPT AI can help. It generates flow diagrams automatically, leaving you free to do the fun parts.
What Is a Flowchart?
A flowchart is a visual guide to a process, system, or algorithm. You use shapes like rectangles, diamonds, ovals, and arrows to illustrate steps, decisions, and sequences. You start with a “Begin” shape, follow arrows through tasks or decision blocks, and end up at a final result. It’s like building a roadmap, but instead of highways and stop signs, you have shapes and arrows.
These diagrams come in different formats, but they all share a similar goal: to remove confusion. They show how a process unfolds. Whether you’re outlining a software program or mapping a customer journey, a flowchart helps you catch potential hiccups. Plus, people learn more easily by seeing things, so if you want to impress your boss or professor, slip in a well-crafted flowchart.
Why Is Flowchart Important?
Flowcharts matter because life is busy and processes can be tricky. We have deadlines to meet, teams to manage, and clients to make happy. A flowchart strips away clutter and leaves you with essential steps. It also helps you spot redundancies. Maybe you have two steps doing the same job. A quick look at your flow diagram types will reveal if something is off.
Flowcharts also support clear communication. Bosses, colleagues, or friends might not read long instructions. But they’ll glance at a flowchart and understand. It’s universal. Flowcharts save time by minimizing back-and-forth explanations. They help in troubleshooting, too. If your workflow breaks, you can trace the diagram to find the issue. In essence, flowcharts are both your roadmap and your detective lens.
16 Common Types of Flowcharts
Flowcharts are versatile tools for visualizing processes, including Process Flowcharts, Workflow Diagrams, Swimlane Diagrams, Data Flow Diagrams, and Decision Flowcharts. Other types include Org Charts, Gantt Charts, SIPOC Diagrams, Activity Diagrams, System Flowcharts, Mind Maps, Cross-Functional Flowcharts, and Business Process Models. Specialized types like EPC, Value Stream Maps, and ISO Diagrams enhance clarity in business, project, and system management. Each serves unique roles in streamlining workflows and communication.
1. Process or Communication FlowChart
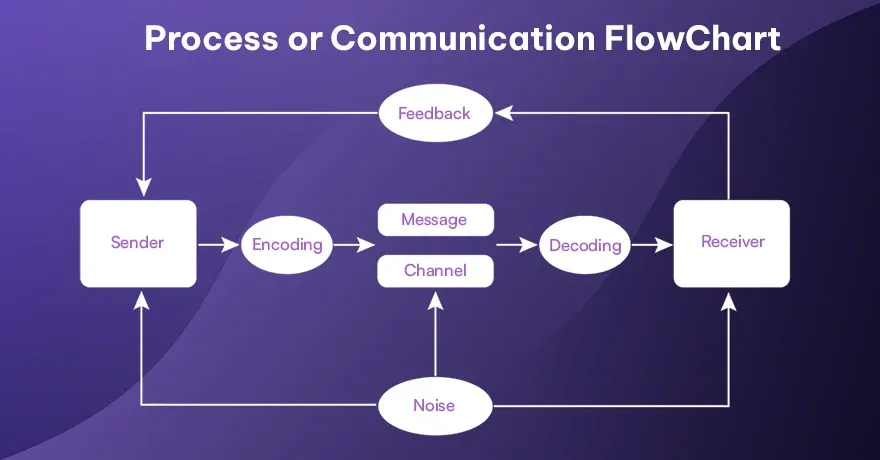
This type shows how tasks or information move from one stage to another. It often highlights the route of messages, documents, or activities among different teams or individuals. Boxes are typically used to label steps and arrows show the sequence. The goal is to provide a clear data so everyone knows their responsibilities. It also helps find where delays occur, since you can see each handoff point. Many organizations rely on it for smooth teamwork and better coordination.
Example:
A company’s communication process for handling a customer complaint. Start at “Complaint Received,” move to “Assign to Support,” decide if it’s urgent, and so on. Each step is clear and methodical.
2. Decision Flowchart
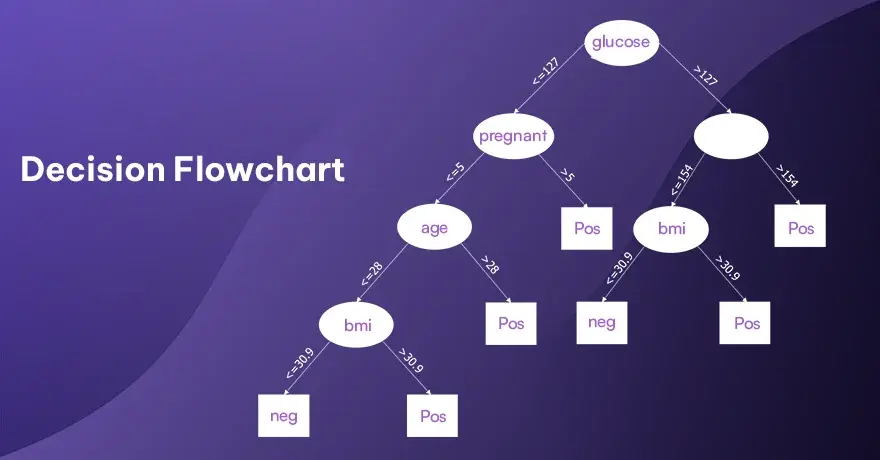
This type focuses on where choices must be made. You usually see diamond shapes marking questions or conditions. Each branch coming from the diamond, guides you toward a possible next step. This chart helps people see the different outcomes and pick the correct path. It works well when processes have several branching points or options. It can prevent confusion by making each choice visible.
 Example:
Imagine you’re deciding whether to watch a movie or read a book tonight. You begin with “Is the movie new?” If yes, watch it. If no, check if you have a new book. Each decision leads to a different action.
3. Workflow Diagram
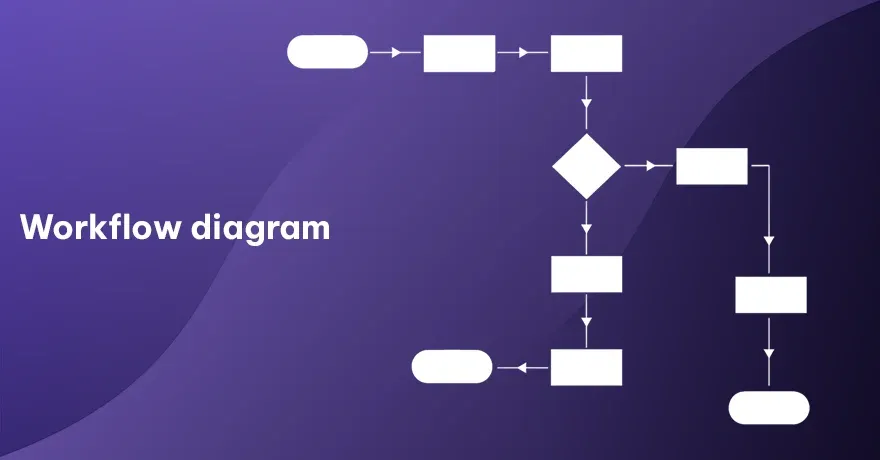
This chart outlines how tasks move across systems. It shows who is responsible for each step, and also in what order tasks are handled to the team. The main benefit is to spotting slowdowns or failed steps in a sequence. Each action appears in a labelled shape, with arrows showing the flow from one step to the next. By using this, teams can keep things running smoothly.
Example:
In a marketing agency, a campaign brief might start in the strategy team, move to creative for design, then pass to media buying before final approval. Each arrow tracks the movement of tasks.
4. Program Flowchart
This flowchart represents the logic behind a computer program. The shapes show actions like input, output, and calculations. Diamond shapes highlight decisions. This layout helps break down complex functions into smaller parts. It makes it easier to plan or review code. It also allows developers to spot logical errors before they write a single line. Anyone reading the chart can follow how data is handled, step by step.
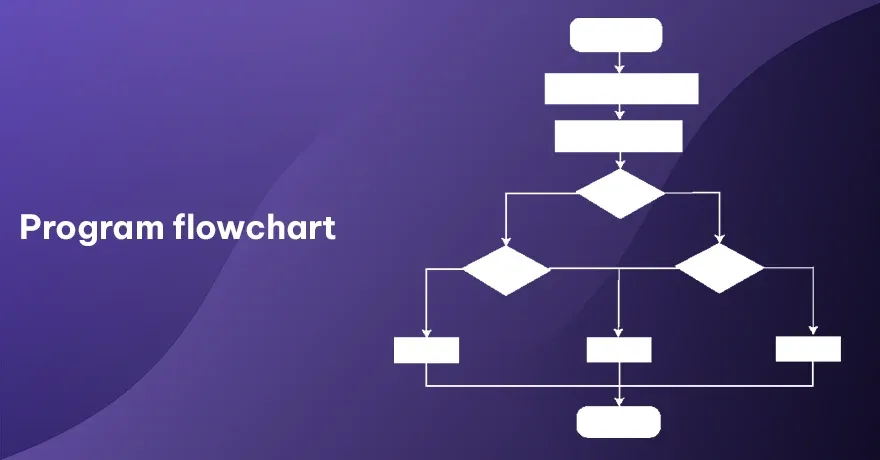
Example:
You might chart a login system. After the user enters credentials, the program checks correctness. If valid, it leads to the user’s dashboard. If not, an error message appears.
5. Functional Flowchart
This chart is divided into sections that each represent a department or a function. Activities appear in the particular section, indicating which team does what. Tasks or actions flow from one section to another. It shows how work is divided and passed along. It gives a broader view of processes that involve many departments. Each group’s tasks stand out, and it becomes easier to track who does each job.
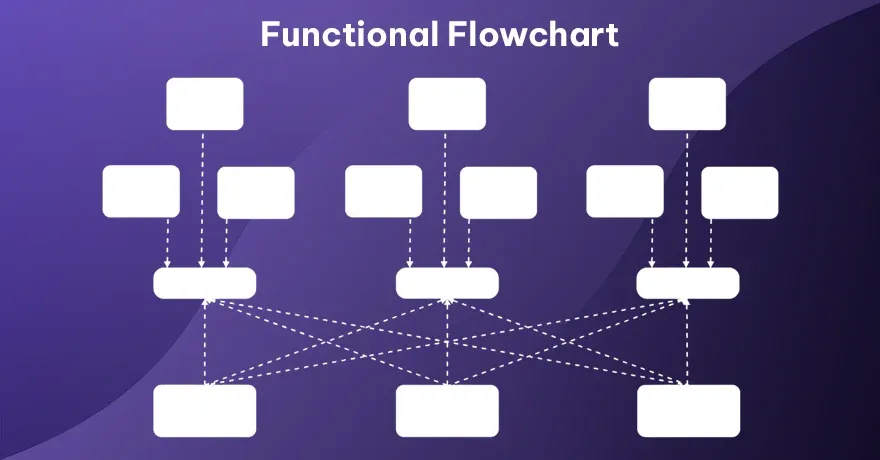
Example:
Consider a product launch. One lane might be marketing tasks, another lane for product design, and another for sales. Each group focuses on tasks relevant to its specialty.
6. Swimlane Flowchart
Swimlane flowcharts are just like functional flowcharts, but with lanes. Each lane belongs to one person, team, or a role. Tasks tied to each role remain in that lane. It keeps responsibility clear. Arrows crossing lanes signal when a task passes from one role to another. This type is useful for tracking processes, where multiple people or groups are involved.
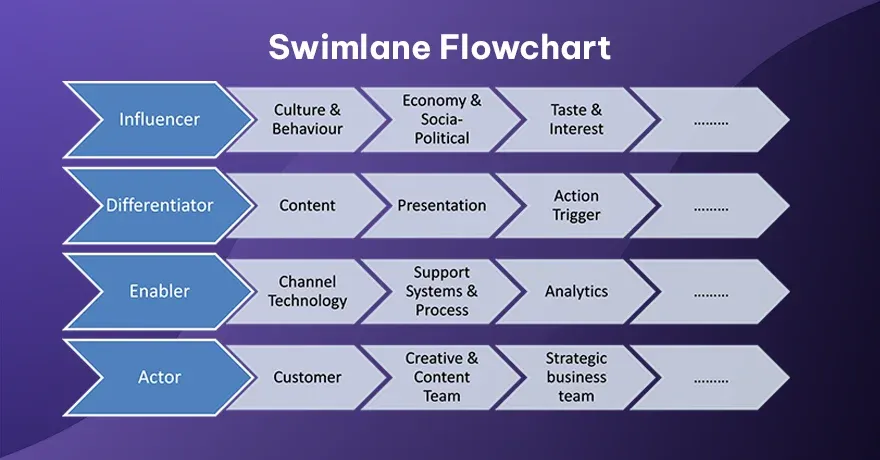
Example:
Onboarding a new employee. HR has one lane, IT has another, and the new hire has their own lane. Each lane’s steps line up in parallel, showing responsibility across the organization.
7. Data or Document Flowchart
This type shows how an information or the documents move within an organization. It focuses on creation, storage, and transfer points. Each shape might show who handles the document and what they do with it. This chart helps identify gaps or errors in handling paperwork or the digital files. It also highlights where bottlenecks might occur.
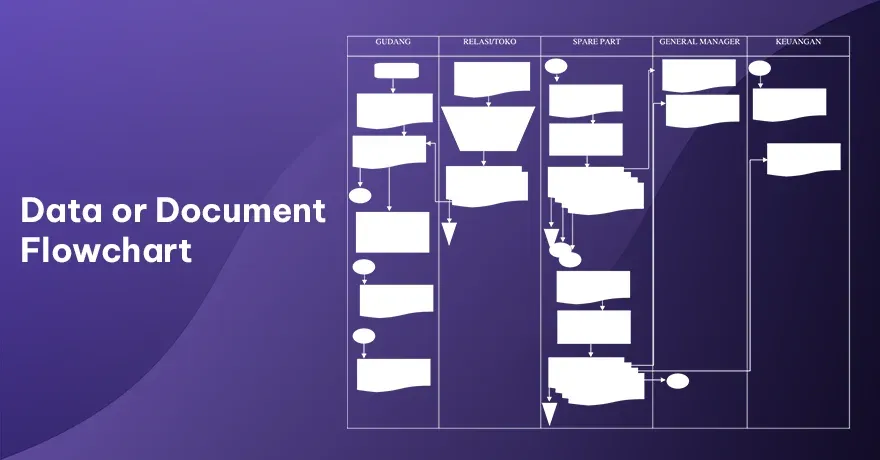
Example:
A login form capturing user data, sending it to a server, verifying credentials, and returning the user’s details. The diagram might show each transformation and storage location.
Also read this article : Best Flowchart Software Tools
8. EPC Flowchart
EPC flowcharts use events and functions as their main elements. Events are passive states, and functions are the active steps in a process. Each function has an incoming event and an outgoing event, which forms a chain. This approach is popular for business process modeling because it shows both triggers and actions. It can also give details about parallel branches if multiple events occur at once.
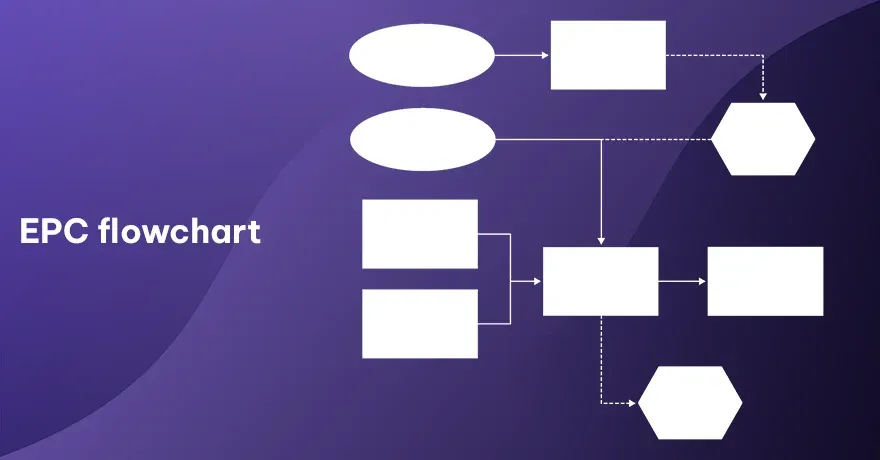
Example:
An online shopping process. “Item Added to Cart” (event) triggers “Update Cart Total” (process), which leads to “Show Updated Cart” (event). Each transition is powered by a specific trigger.
9. PERT Chart
A PERT chart stands for Program Evaluation and Review Technique. It orgnizes tasks, their durations, and how they depend on each other. The main purpose of this is managing time and forecasting project completion. Arrows often connect tasks to show which steps come first. It’s helpful for large or complex projects where timing is very much crucial.
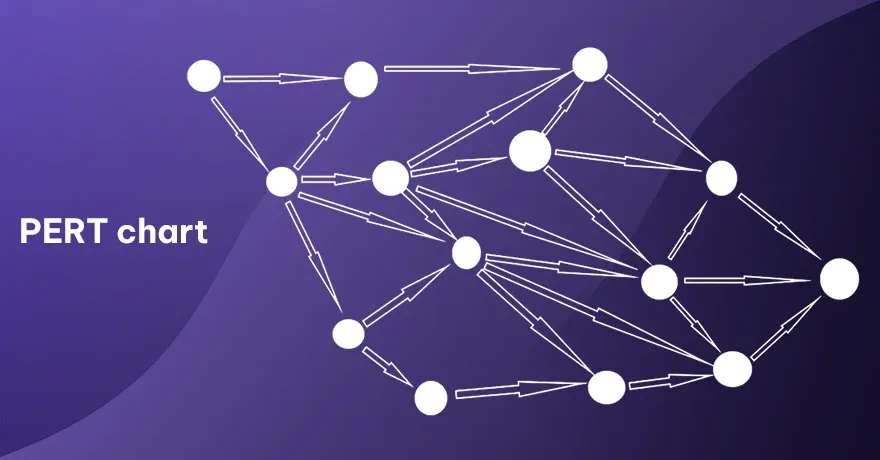
Example:
A construction project might have tasks like “Lay Foundation,” “Build Walls,” and “Install Roof.” Each task depends on the previous one. The diagram helps you see where delays can happen.
10. Use Case Flowchart
This diagram shows user interactions with a system. It begins with a user action, followed by how the system responds. Arrows guide you through each step of the interaction. It highlights possible paths, including errors or alternative flows. This type is commonly used in software design, helping teams define what features are needed.
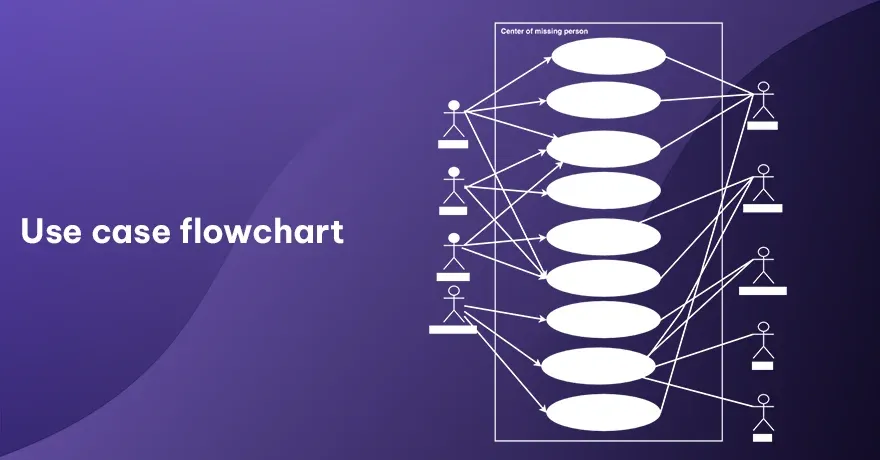
Example:
For a music app, you might show how a user creates a playlist, adds songs, or removes them. Each step outlines the software’s response and the user’s next action.
11. Customer Journey Flowchart
This type shows how a customer interacts with a product or service at each stage. It breaks down the path from the first point of contact to final follow-up. Each step is created to better understand the customer behavior. It also pinpoints areas that might need improvement. By visualizing the steps, businesses can plan better to meet customer needs better.
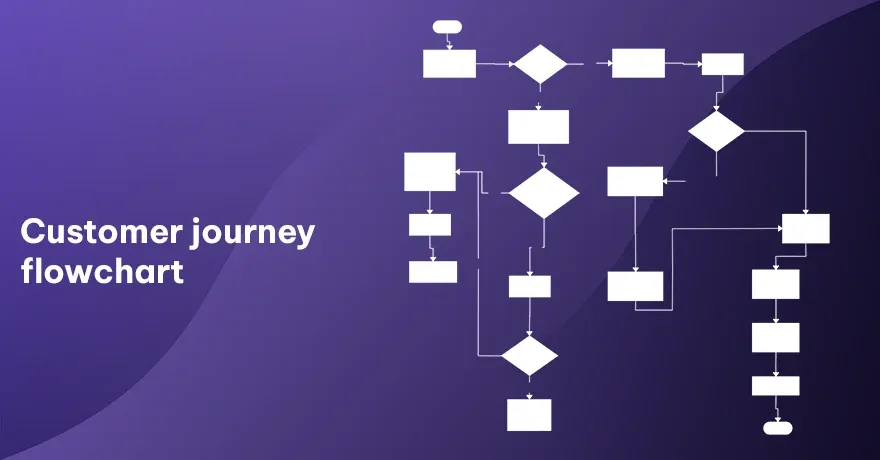
Example:
You might map a diner’s experience at a restaurant. From parking the car, to placing the order, enjoying the meal, and finally paying the bill. Each touchpoint is documented.
12. Website Flowchart
Website flowcharts show the structure and navigation of a site. They show pages, how they connect, and the links that let users jump from one page to another. This is useful when planning a site’s layout or reworking on an existing one. It helps design teams plan menus, sub-pages, and user paths. It can also find if certain pages require extra links or content.
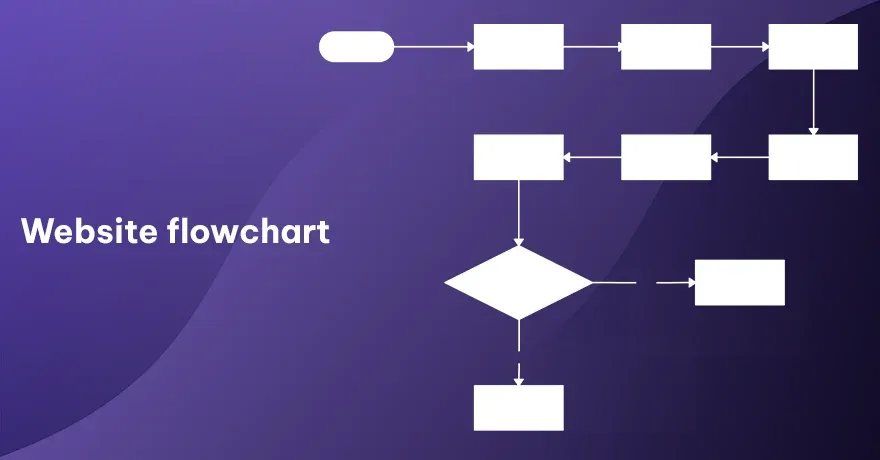
Example:
You might have a home page feeding into an “About” page, “Services,” and “Contact.” Under “Services,” you branch into “Pricing,” “Testimonials,” and so on.
13. Production Flowchart
This diagram focuses on the steps to create a product. It may begin with raw materials and end with finished items. It includes quality checks along the way. It shows how products move through each production stage. Managers may find inefficiencies resources with this view. It’s widely adopted in factories and related sectors.
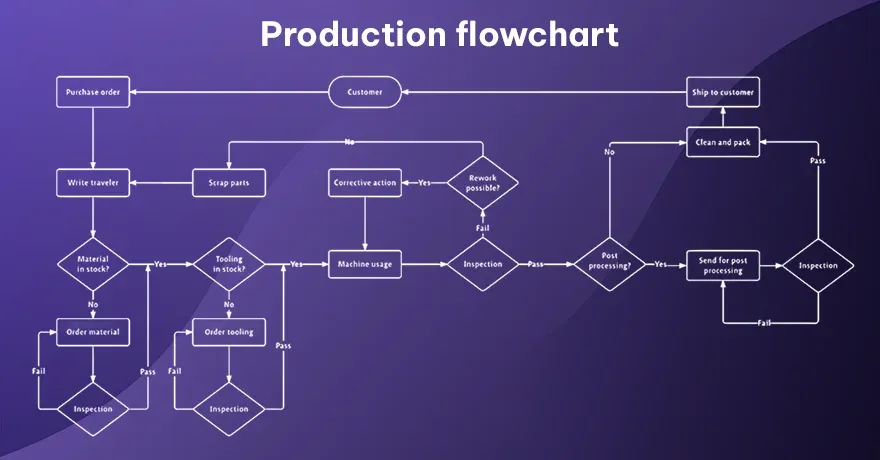
Example:
Making a smartphone. Start with “Procure Components,” then “Assemble Parts,” then “Test Device,” and finally “Package for Shipping.” Each step ensures product quality.
14. Logical Model Flowchart
A logical model flowchart shows the logical order of operations, without diving into technical details. It is often used in planning, to visualize how information or tasks should flow. Each node represents a specific function or decision. It lets designers or analysts focus on logic rather than hardware specifics. This chart acts like a roadmap for further detailed design.
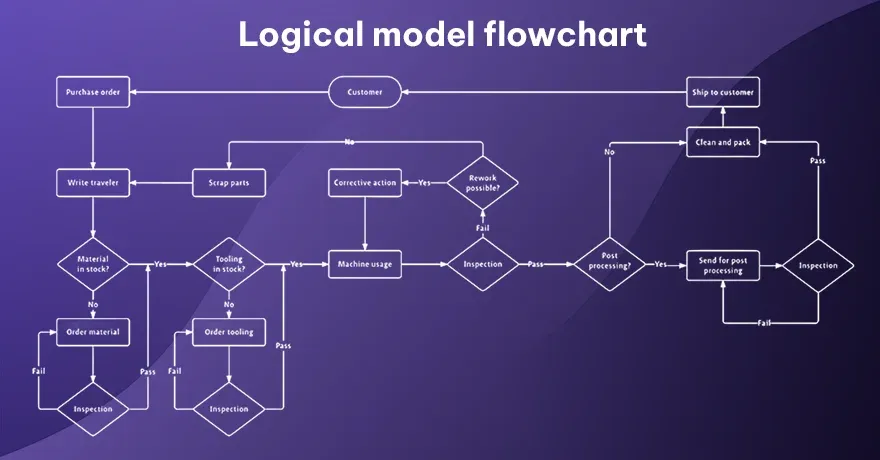
Example:
You might plan how data flows through a new database for patient records at a clinic. Each step addresses data input, validation, and retrieval processes.
15. Code Flowchart
A code flowchart maps out lines of code, as shapes for functions, loops, or decisions. It offers a clear look at how each section of the code runs. Programmers can refine logic, spot errors, or plan improvements by reviewing this chart. It’s often helpful in the complex projects where multiple scripts must interact properly.
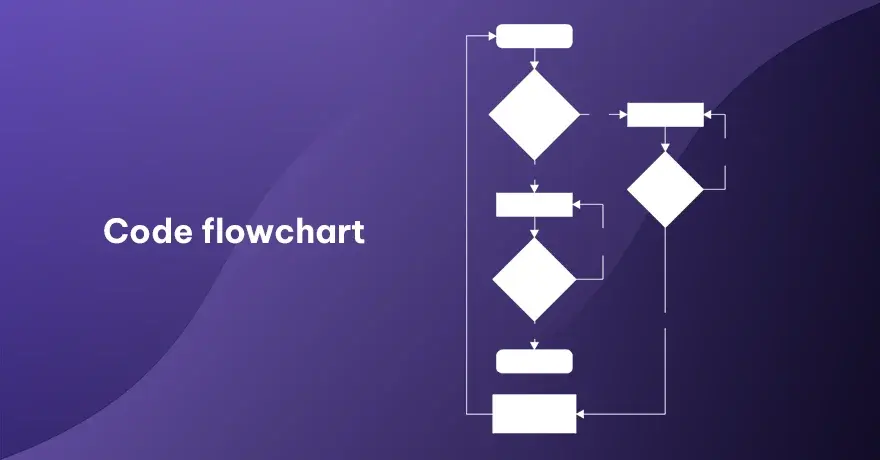 Example:
For a complex feature like image processing, you’d show steps to load an image, check size, apply filters, and handle error codes. It’s extremely detailed for debugging or teaching.
16. E-commerce Flowchart
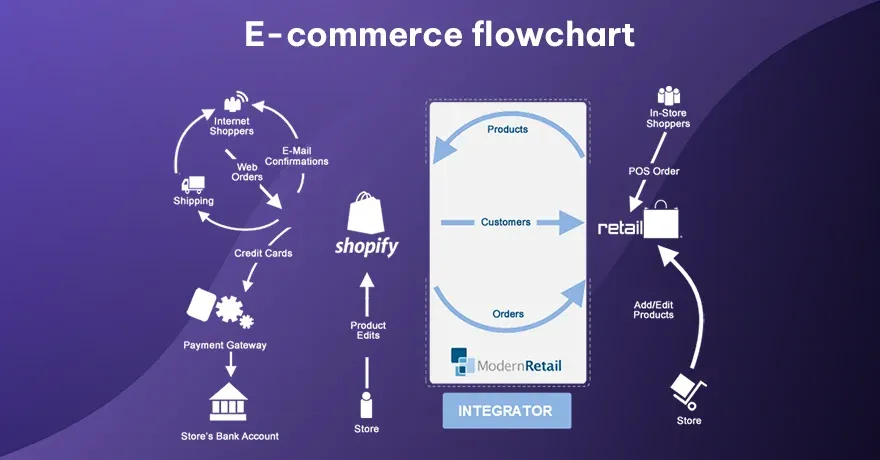
This chart shows the steps online shoppers take - from browsing products to placing orders. It shows how items go into the cart, how customers check out, and what payment processes look like. It also includes points where users might cancel, return to browsing, or contact support. The flowchart helps businesses clarify each stage in online sales.
Example:
Imagine a user selecting a product, adding it to the cart, checking out, paying, receiving a confirmation email, and then seeing shipping notifications. The flowchart covers every step until delivery.
Try Flowcharting With AssignmentGPT AI
Now, let’s talk about making life simpler. Flowcharts are great, but manually drawing them can be a drag. That’s where AssignmentGPT AI Diagram Generator steps in. By simply typing a description of your process, you get a clean, professional diagram in seconds. It’s like having a personal assistant who magically turns your scribbles into crisp shapes and arrows.
Whether you’re mapping out a new marketing campaign or coding logic for a mobile app, the tool’s AI engine speeds things up. You don’t have to worry about alignment or standard symbols. That’s all handled automatically. Plus, you can edit and fine-tune on the fly. It’s an ideal solution for students who need quick types of flowcharts for class assignments or for professionals rushing to meet deadlines.
Conclusion
Flowcharts turn complicated messes into clear, step-by-step visuals. They help you plan, communicate, and troubleshoot. They’re also surprisingly fun once you get the hang of them. Whether you need a straightforward flow chart for a daily routine or an advanced diagram for an entire manufacturing chain, there’s a flowchart type that fits.
If you find yourself spending too much time wrangling shapes or worrying about how best t illustrate a decision node, consider an AI-based tool like AssignmentGPT. It takes the guesswork out of design and leaves you with a polished types of flow diagram in record time. Go ahead and give it a shot. You might wonder how you ever managed without it.
FAQs
1. Are flowcharts only for complicated processes?
2. What’s the difference between a workflow diagram and a swimlane flowchart?
3. Do I need special software to create flowcharts?
4. How can flowcharts improve my team’s communication?
5. Is AssignmentGPT AI easy for beginners?
Content writer at @AssignmentGPT
Kandarp’s world is powered by conversations, content, and creativity. With experience across branding, literature, publishing, and strategy, he has helped shape identities and stories for businesses across industries. At AssignmentGPT AI, he leads a team that blends sharp content, strong design, and local insight to turn businesses into brands that connect with people.
Master AI with
AssignmentGPT!
Get exclusive access to insider AI stories, tips and tricks. Sign up to the newsletter and be in the know!

Transform Your Studies with the Power of AssignmentGPT
Empower your academic pursuits with tools to enhance your learning speed and optimize your productivity, enabling you to excel in your studies with greater ease.
Start Your Free Trial ➤Start your success story with Assignment GPT! 🌟 Let's soar! 🚀
Step into the future of writing with our AI-powered platform. Start your free trial today and revolutionize your productivity, saving over 20 hours weekly.
Try For FREE ➤