AssignmentGPT Blogs


In today’s fast-paced digital world, understanding and streamlining processes is more critical than ever. Whether you’re designing a new app interface, website, optimizing team workflows, or documenting system architecture, flowcharts are a powerful tool to visualize and communicate complex systems with clarity and simplicity. Flowcharts are not only very important for professional work in today's time, but also in academic sectors. Flowcharts play a very important role, it is easy to give education of any complex or detailed subject to students with the help of Flowcharts. Whether you are a teacher, on a professional job or an educational content creator, when you use flowcharts, the quality and effectiveness of data representation increases significantly.
Flowcharts aren't just diagrams; they are bridges that connect ideas to execution. With the rise of AI-powered tools like AssignmentGPT, creating professional-grade diagrams is easier, faster, and more collaborative than ever before. After reading this article you will understand the importance of Flowcharts or even if your background is not that creative, it doesn't matter because we will also learn how to create Flowcharts in simple steps.
Quick Summary
Flowcharts are visual representations of processes, systems, or workflows. They use standardized symbols like rectangles, diamonds, circles, and arrows to represent actions, decisions, and flow of control. Flowcharts enhance clarity, coordination, documentation, and efficiency in teams and organizations. And if you feel that Flowcharts are part of the digital world, let me tell you that Flowcharts were used before as well. If you have ever noticed your computer science book, you must have seen Flowcharts. But in today's digital world, creating Flowcharts has become quite easy and the data representation found to be quite appealing, so most people prefer using it now. And in the market, tools like AssignmentGPT AI help automate and simplify flowchart creation using AI-powered design engines.
And you can easily create Flowcharts using this AI tool whether you are a beginner or a professional.
What is the Purpose or Function of Your Flowchart?
In today's current time there are many professorial or academic reasons for making Flowcharts but still if you do not have that much experience with Flowcharts or if you are a beginner then before creating any flowchart, the first step is defining its purpose. Why are you creating this diagram, what message do you want to easily communicate through it? Many people think that Flowcharts are used to make the representation aesthetic, but it is not so at all, they have their own different purpose and use case, in which we convert complex topics or data into a proper structural form so that it is easy for the reader to understand and the data also seems appealing. So whenever you think of creating Flowcharts, first ask yourself basic questions, Is the flowchart meant to show a process for onboarding users, Are you mapping out a software development cycle, Do you want to document a troubleshooting system, Is your goal to streamline team workflows.
Each flowchart is unique and its structure will vary based on your target audience and specific application. When you begin with a clearly defined purpose, the rest of the design process becomes easier, more efficient, and goal-oriented. Overall creating flowcharts depends on your subject or data, there is a lot of data that you cannot represent effectively in flowcharts.
Also read this article : What is a Flowchart?
Why Flowcharts Matter
Creating flowcharts might seem like a basic task, but the impact they have on project management, software design, education, and communication is profound. If you have ever seen Flowcharts in any book, YouTube videos or from assignments, you must have noticed that remembering the data and information of such flowcharts in a systematic way is much easier compared with paragraphs or from bullet points data. So let us know why Flowcharts are so important in today's time.

1. Clarity
Did you know that 65% of people are visual learners? Flowcharts help transform complicated ideas into digestible visuals that everyone can understand. Whether you're explaining a new company policy or mapping out user flows for a website, a well-structured flowchart brings clarity to every step. Flowcharts are also very important from the educational perspective, because in today's time there is so much distraction in the lives of students, that for effective learning there cannot be better training than visual representation and for this, flowcharts are a very good option.
It simplifies the abstract, helping teams grasp the big picture and understand their role in the process. With clear direction and logical flow, misunderstandings are minimized, leading to fewer errors and better collaboration.
2. Coordination
In team environments, especially in cross-functional or remote teams, coordination is everything. Flowcharts break down processes into a logical sequence of actions that team members can follow. Everyone knows what happens next and where they fit in the bigger picture. It has been quite easy to represent any data in flowcharts. For example: If you are a team head and you have to tell your team what our project is and what is the role of each person in the project and which process they have to follow, then explaining this data in paragraph format is quite difficult and there will be a lot of mistakes and lack of clarity among the employees. Instead, if you represent this data on flowcharts then it is quite easy to represent and the best thing about flowcharts is that it takes less textual content, due to which a lot of time is also saved.
In addition, whether it's product development, customer support, or content creation, flowcharts provide a visual map that aligns team efforts. This clarity reduces back-and-forth communications and enhances productivity.
3. Efficiency
Flowcharts help identify redundancies, unnecessary steps, or potential bottlenecks in workflows. By visually laying out each component of a system, inefficiencies become glaringly obvious. You can then revise and optimize your processes for better results. As we have already seen in the previous paragraph, the textual content or part in Flowcharts is very less, hence creating Flowcharts is quite easy compared with any representation shown in the paragraph.
They are particularly useful during audits, quality assurance, and systems analysis. The ability to trace a process from start to finish with minimal confusion makes troubleshooting faster and solutions more actionable.
4. Documentation
Flowcharts also serve as documentation for future reference. They record how a system or process was structured, providing valuable insights for onboarding new team members, training, or revisiting decisions during reviews.
A visually documented process is easier to refer to than long textual documents. With cloud-based tools, these flowcharts can be updated, shared, and archived for future access. Managing textual documents is more difficult compared to flowcharts and it is also easy to find flowcharts in any requirement and the mind remembers them easily because visual representations are remembered by humans quickly and for a longer time.
What Do Flowchart Symbols Mean?
Flowcharts rely on a standardized set of symbols to convey meaning. This is why these symbols are used in Flowcharts, so that the Flowchart can be made more attractive and the right data can be represented in the right shape. These visual cues help make the diagram universally understandable. Let's explore the most common symbols and their functions:

1.Rectangles
Meaning: Action or process step.
The rectangle, also known as a "process" symbol, represents a specific action, task, or operation within the flow. These are the “doing” parts of the diagram. For instance, in a website user flow, actions like "Log In," "Enter Email," or "Click Checkout" would be represented using rectangles. Basically a rectangle is considered a fundamental shape highlighting specific steps or actions. If you want to use rectangle shape in Flowchart, ensure each rectangle contains a clear, concise verb. For example, write “Verify Payment” instead of just “Payment.”
2. Lines and Arrows
Meaning: Flow or direction of control.
Whether you are a student or a professional person, lines and arrows will be visible wherever you are, lines and arrows connect all the elements in a flowchart. They represent the direction in which the process flows, guiding the user from one step to the next. There are several types: Straight arrows: Indicate straightforward progress, Return arrows: Show looping or going back to a previous step, Dotted-line arrows: Used to indicate a suggestion or optional step, Forked arrows: Represent different outcomes from a decision point. And if you use lines or arrows, try to use consistent arrows of different types throughout the chart to avoid confusion.
3. Rhombus
Meaning: Input or output.
A rhombus shape (also called a parallelogram in some versions) is used for data input or output steps. This could include user actions like “Enter Name,” “Input Address,” or system actions such as “Display Receipt.” Always follow input/output symbols with actions or decisions to maintain logical flow.
4. Circles
Meaning: Start or end point.
Circles are used to indicate where the flowchart begins or ends. They provide visual anchors, ensuring the viewer knows where the process starts and concludes. Start circle: Often labeled with “Start.”, End circle: Labeled “End” or with the final output of the process. In some cases, small circles (known as connectors) are also used to show continuity from one part of the chart to another, especially in complex diagrams.
5. Diamonds
Meaning: Decision point.
Diamonds represent questions or decisions. These are critical junctures where the flow may branch out based on the answer. Common decision examples include, Is password correct, Has payment been received, Do you want to continue. Whenever you use diamonds in Flowcharts, try that each diamond should have at least two arrows coming out of it, usually labeled “Yes” and “No” or other logical options.
Read More : Types of Flowcharts
How to Make a Flowchart with AssignmentGPT AI
Creating a flowchart from scratch used to be time-consuming. But today it has become easier to create flowcharts or creative works because of AI tools, and one of the best tools is AssignmentGPT diagram generator, and this platform simplifies the process with intuitive interfaces, customizable templates, and intelligent automation. Let's learn how you can create flowcharts using AssignmentGPT AI.
Step 1: Title Your Flowchart
First of all, you need to choose the name of your project or flowchart, and every flowchart should have a clear, descriptive title. This ensures that anyone looking at the diagram immediately understands its purpose. When typing the title of your flowchart, make sure that instead of “Login Process,” use “ User Login Process for E-commerce Website. Center the title at the top of your chart. Use a bold font and proper capitalization for readability. To make your flowcharts appealing, this step sets the tone and scope of the chart crucial for audience engagement and understanding.
Step 2: Select Your Flowchart Template
AssignmentGPT AI offers a variety of templates tailored for different types of workflows. So whatever template you choose, select it according to your project or work, these are the following main diagram types which are available in this platform.
Flowchart Diagram: The most common template, ideal for mapping step-by-step processes. Use this for UX flows, team task breakdowns, onboarding sequences, etc.
Class Diagram: Used in software development and object-oriented programming to illustrate class. structures, including attributes, methods, and relationships.
ER (Entity-Relationship) Diagram: Best suited for database design, showcasing entities, attributes, and relationships between data points.
Step 3: Diagram Topic
Next, enter the topic of your diagram. This could be a task, project, system, or idea you want to visualize. For example "Customer Onboarding Workflow" AssignmentGPT will use this topic to generate relevant structure and layout options. Make sure it accurately reflects the process you're mapping.
Step 4: Diagram Description
Provide a brief description of the process or system. This helps the AI engine understand context and customize the diagram accurately.
Example: "This diagram illustrates the steps a user follows to sign up on a learning management system, verify their email, and access course materials."
The more specific you are here, the better the AI can generate accurate flow and labels. This also improves collaboration if you’re sharing the diagram with teammates.
Step 5: Polish Your Flowchart
Once the initial diagram is generated, it’s time to polish it:
- Adjust symbol positions to improve visual alignment.
- Change colors and fonts to match your brand or presentation theme.
- Label each shape with action-oriented, concise text.
- Add or delete steps as necessary so that the Flowchart can be optimized.
AssignmentGPT AI allows real-time editing, team collaboration, and exporting in formats like PNG, PDF, or HTML5. You can also invite collaborators by sharing a link directly. Additionally, if you need to improve your Flowchart, use Figma's color wheel or AssignmentGPT's built-in style library to maintain a visually cohesive design.
Conclusion
Flowcharts are more than just diagrams they are strategic tools for visual thinking, efficient execution, and effective collaboration. Whether you’re a student, developer, designer, or manager, mastering the art of flowcharting empowers you to present information clearly and solve problems creatively. Personally, the best thing about flowcharts is that they seem to be created very quickly, and compared to textual content, there is very less content in it and the flowchart is quite appealing to look at.
With powerful tools like AssignmentGPT AI, the creation process becomes seamless. You can now convert complex ideas into structured visuals in seconds, enabling smarter decisions, better presentations, and stronger teamwork.
From understanding basic symbols to using templates and AI-based enhancements, you've now explored the full journey of crafting a flowchart from start to finish. Whether you're documenting a new process or ideating a future system, try to create the best flowcharts so that your assignment, presentation, or project framework looks attractive and informative.
##FAQs
1. What is a flowchart used for?
2. What are the main types of flowcharts?
3. Can beginners use AssignmentGPT to make flowcharts?
4. Are flowcharts useful in software development?
Content writer at @AssignmentGPT
Ashu Singh, content writer at AssignmentGPT, crafting clear, engaging content that simplifies complex tech topics, with a focus on AI tools and digital platforms for empowered user experiences.
Master AI with
AssignmentGPT!
Get exclusive access to insider AI stories, tips and tricks. Sign up to the newsletter and be in the know!
Transform Your Studies with the Power of AssignmentGPT
Empower your academic pursuits with tools to enhance your learning speed and optimize your productivity, enabling you to excel in your studies with greater ease.
Start Your Free Trial ➤Related Articles

AI Homework Helpers: How They Are Changing Study Habits
AI homework helpers explain concepts step by step, helping students learn faster, study smarter, and build lasting confidence.

Best Flowchart Software Tools for Students and Developers
Compare the best flowchart tools for students, developers & engineers to create clear diagrams fast.

Best AI Diagram Tools for Engineers and Claude Code (2026)
Compare the best AI diagram tools for Claude Code workflows, engineering teams, and students in 2026.
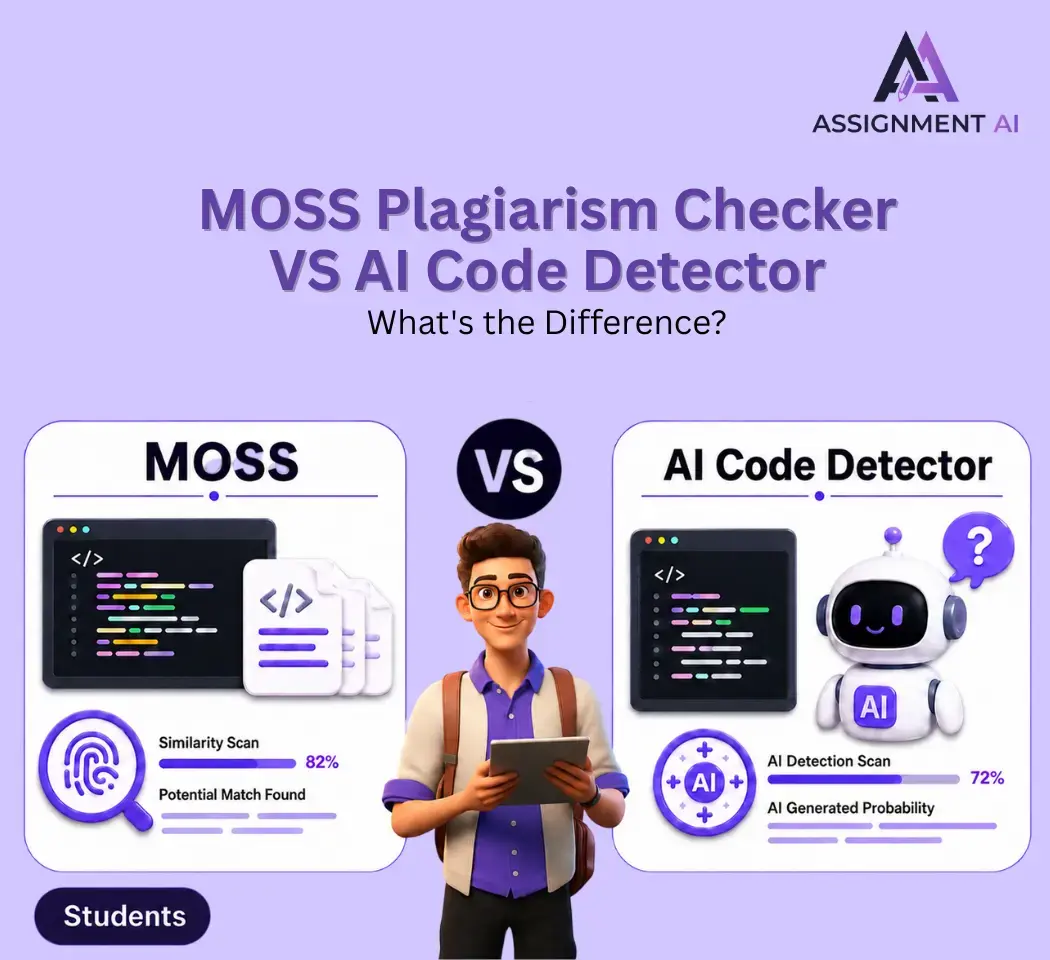
MOSS Plagiarism Checker vs AI Code Detector: Key Differences
MOSS detects copied code between students. AI code detectors spot AI-generated code. Learn which tool to use and when.

Why Students Use AI Code Generators for Programming
Learn how AI code generators help students tackle programming assignments faster and smarter in 2026.

How to Make a Flowchart in 5 Minutes Using AssignmentGPT AI
Make professional flowcharts in minutes using AssignmentGPT AI's diagram generator. No design skills required.
Start your success story with Assignment GPT! 🌟 Let's soar! 🚀
Step into the future of writing with our AI-powered platform. Start your free trial today and revolutionize your productivity, saving over 20 hours weekly.
Try For FREE ➤