AssignmentGPT Blogs
One of the most important things that have to be done when working with data or doing any kind of thinking is to create a visual representation of the data. A cluster diagram is a graphical way to capture your ideas or projects.
The user can rely on or organize them in a way that working relationships or connections are obvious. No matter if you are solving a complex analysis problem, planning a project, or maybe creating a customer journey map, a cluster diagram can be used to logically organize items. It should be clearly understood by the viewer.
Quick Summary
In this blog, we’ll get to know what cluster diagrams are and how they can be used to identify relationships and connections.
Cluster Diagram: What Is It?
A cluster diagram organizes information around a central theme by grouping related ideas, words, or concepts in a circular or interconnected format. By visually connecting ideas, this helps clarify complex information. That makes it easier to explore connections between different ideas or data points.
They are used in many ways for the breakdown of information, analysis, and brainstorming. Especially in large projects or study areas where the data can be confusing. Cluster diagram examples could be organizational charts, market segmentation analysis, and even educational tools.
Comparing Cluster Diagrams to Mind Maps
Cluster diagrams and mind maps are two ways of visualizing information. Still, they are for different reasons and in different places. Mind maps expand one central idea and its related sub-ideas. Whereas cluster graphs are for mapping out relationships and categorizing the various data sets.
Such an illustration in cluster mapping could be to map the customer segments based on their purchasing behavior. While the experimental group might be exploring the ideas for a new product launch through the process of the mind map.
Both are useful, but when it comes to mind maps, they are a brainstorming weapon. Cluster diagrams are necessary in the organizational combination of complex data.
A cluster mapping example involves the task of data analysis and brainstorming particularly in large scale projects or domains.
Also read this article : Best Diagram Software Tools in 2023
A Variety of Cluster Diagram Types
Different categories of the cluster diagrams are not universal and therefore, they are unique to a task helping in different spheres of planning, analysis, and decision-making.
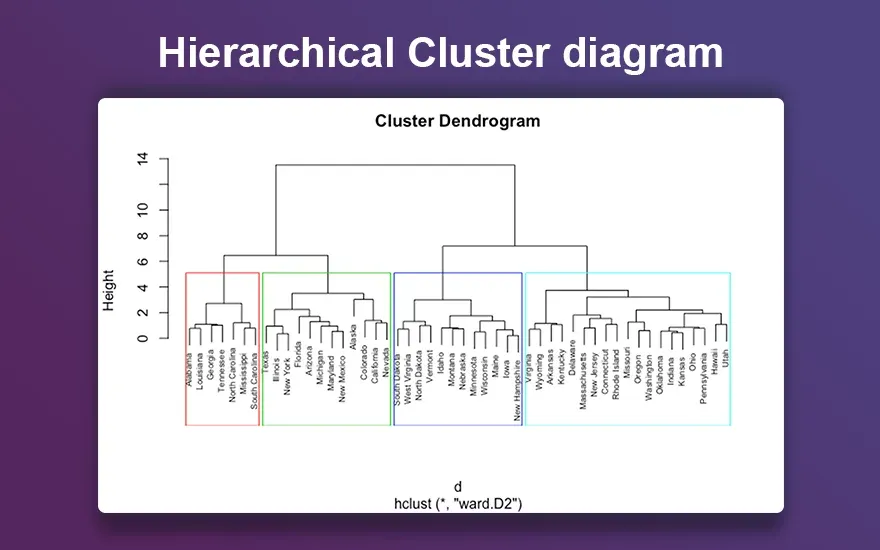
1. Hierarchical Cluster Diagram
A hierarchical cluster diagram is designed with a top-bottom or a bottom-top approach. Each level of the hierarchy is groups or subgroups.
This is particularly useful in organizational structures, data analysis and taxonomic classifications. These relationships between clusters are based on a ranking system.
2. Centroid-Based Diagram
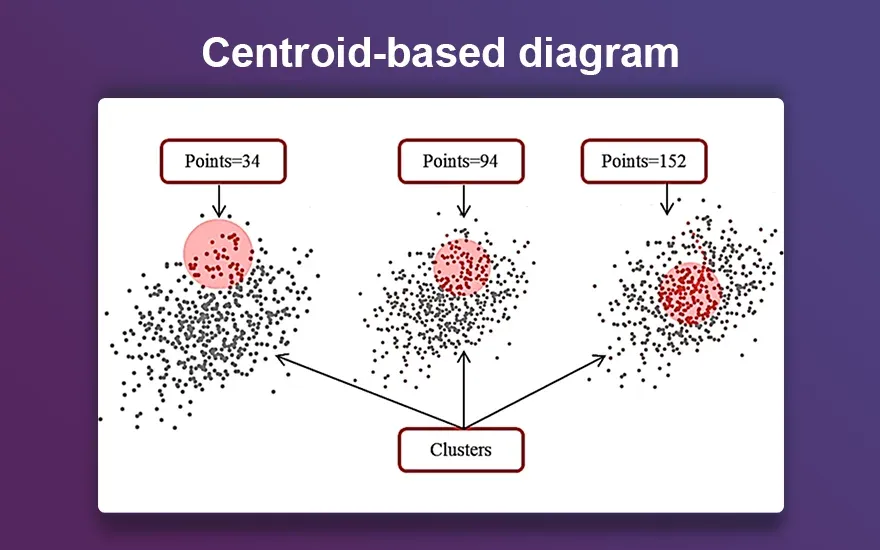
The goal of centroid-based clustering is to group data points around the central point, which is denoted as centroid.
Common in data science and machine learning, centroid-based clustering algorithms organize data points in proximity to these central locations. The method is ideal for analyzing datasets where groups or categories are not initially obvious.
3. Distribution-Based Diagram
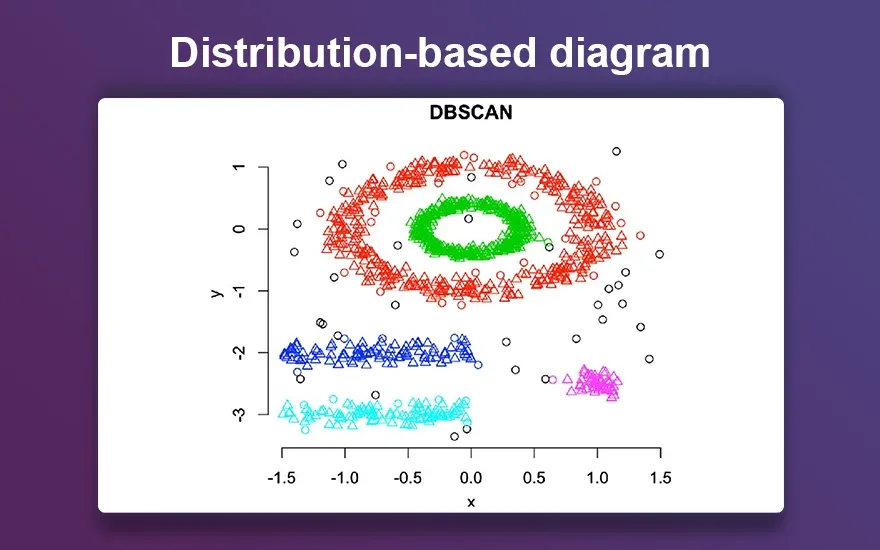
Distribution-Based Diagrams belong to the group of diagrams that demonstrate the transition of data by the normal distribution. This sorts out the data into its distributional clusters based on the statistical probability.
They are commonly used in statistical modeling and machine learning and can catch data that has relationships that overlap. So, they would have layers of relationships among them which are suitable for complex data structures.
4. Density-Based Diagram
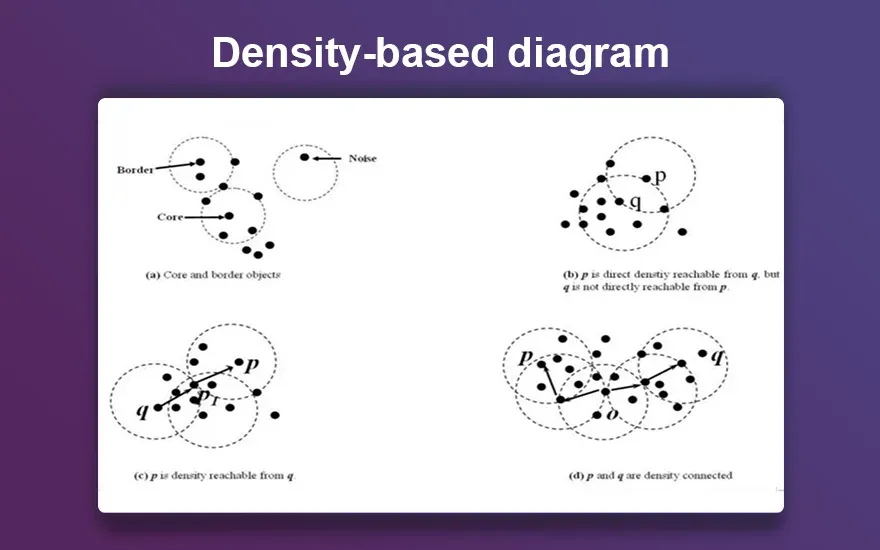
In density-based clustering, the data points are categorized based on the regions of high density.
The clusters are formed where the data points are close to each other, thereby denoting the sparse regions as noise. This works most effectively in data analysis, detection and identifying in large datasets with awkward shapes.
Cluster diagrams come in a variety of forms and each of them serves its purpose in planning, analysis, and decision-making.
Example of a cluster diagram: In the organization chart, the figure of the CEO is at the top, underneath you can find the department heads, team leaders, and workers in the sector, all at the lower levels, thus displaying the management levels of a company.
A Cluster Diagrams Uses
Cluster diagrams find their implementation in vast numbers of different industries which serve a multitude of purposes. Following is the expanded version of the applications which are as follows:
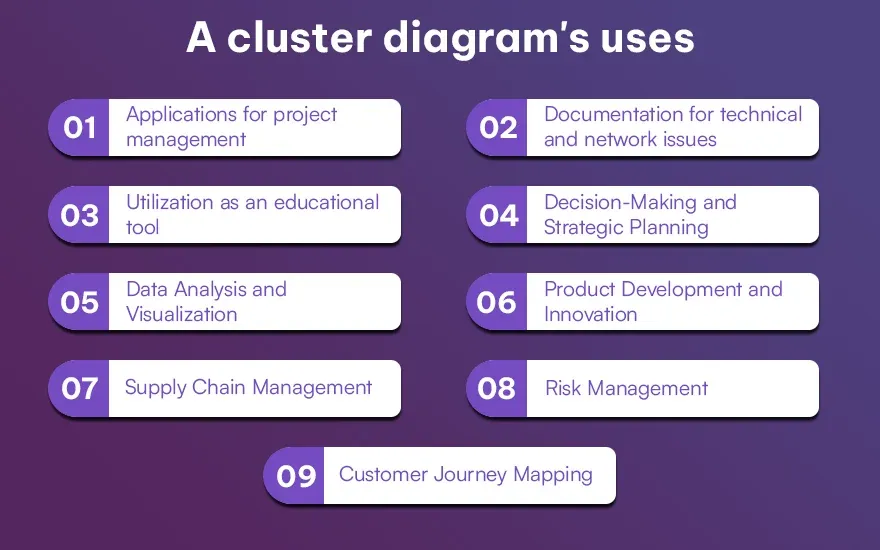
1. Applications for Project Management
In project management, cluster diagrams work together with management to separate the project into several pieces. This makes it easier to manage and identify the correlative parts.
Managing these tasks and their dependencies are the things which the project managers can do. So, this is how they will allocate resources.
2. Documentation for Technical and Network Issues
While troubleshooting technical problems, the application of cluster diagrams can display single points of failure. Map connecting devices and show the pathway of data flow. The graphical overview is a convenient way to identify problems, trace system components, and accordingly plan solutions.
3. Utilization as an Educational Tool
Cluster diagrams are utilized by educators. Educators transform abstract ideas into a simplistically comprehensible format. By categorizing the information into the diagram, the pupils are moving through the information which allows them to address their own curiosity.
This circular task is a crucial element of brain-based learning. The teacher assigns them a task as a group.
4. Decision-Making and Strategic Planning
In business strategy, cluster diagrams are utilized to judge market situations, competitor analysis, and risk assessment.
The ability to see these relationships with virtue and strategists can quickly conjure up patterns and backed up by real data. It also ensures long-term success.
5. Data Analysis and Visualization
A diagram of clusters is employed by data scientists and analysts. Bringing out the patterns in data would enable them to find the data quickly.
In research, the use of variables in a cluster diagram can be used to detect the relationships between these variables. In instance, hypothesis testing and data analysis of the data can be done.
6. Product Development and Innovation
Cluster diagrams are one of the tools used by product development teams during brainstorming sessions. Generating several design choices at a group consensus is very helpful.
However, the fact that they are the enablers of simulation, they are how the groups learn the elements of the product are interconnecting and develop innovative solutions to the problems they are facing.
7. Supply Chain Management
Cluster diagrams are the graphs developed in supply chain management. That indicates the relation between the suppliers, manufacturers and distributors. They help in spotting inefficiency and streamlining the production process.
They can make it easier for the teams to see the complex supply networks by maps. Thus, logistics shall be more successful, and the decision process shall become better-informed.
8. Risk Management
Cluster diagrams can help managers identify threats within a project or organization.
The team can come up with solution strategies for these problems which will automatically help them acquire the ability to survive the tough situation.
9. Customer Journey Mapping
For a cluster diagram on customer journey mapping, it would show the customers' experience at every point by visualizing it.
In the first stage, clients will know about the company through Visual Connection. A client ends up following two other firms' social media accounts when he comes to know about the company through the same channels.
How can AssignmentGPT help with Cluster Diagrams? AssignmentGPT automates cluster diagram creation, saving time and ensuring visually appealing results for assignments or projects.
Advantages of Cluster Diagrams
Cluster diagrams are of great value in organizing and analyzing data. Following are certain specific advantages:
1. Enhanced Clarity
Cluster diagrams can clarify complex data that is visualizing connections. Also, they can be a tool for the study of associations that might not be obvious to you at first glance.
2. Better Decision-Making
These are useful for you to compare the different factors and their connections. This will be the basis of more astute and effective decision making.
3. Promotes Collaboration
Cluster diagrams show team members how communication can occur. Also, communication leads to better understanding and is among the reasons why they are highly dissatisfied with it.
4. Saves Time
Cluster diagrams allow you to more quickly analyze the material by dividing it into visual parts. This is why they have a great advantage in such projects. Chunks of the data infographic help in analyzing faster, which is why they are suited to quick project deadlines.
5. Encourages Creativity
With the cluster diagrams supporting idea generation, more creative ideas are coming out through the new relationships and connections that are presented. When brainstorming, cluster diagrams trigger novel ideas by displaying unexpected relationships and connections.
Conclusion
Cluster diagrams can be used in a variety of applications, starting from project management and data analysis to product development and risk management.
They are capable of organizing complex information visually and really do support activities such as decision-making and planning.
If you await a method that is simple enough to create cluster diagrams, the AssignmentGPT AI's Diagram Maker Tool provides a straightforward way for the users. It is friendly and the diagrams are convenient for use when any task or need arises in a chosen area or with a given business.
FAQs
1. What is the use of a cluster diagram?
2. How does a cluster diagram differ from a mind map?
3. What industries use cluster diagrams the most?
4. Can I create a cluster diagram without specialized software?
Content writer at @AssignmentGPT
Kandarp’s world is powered by conversations, content, and creativity. With experience across branding, literature, publishing, and strategy, he has helped shape identities and stories for businesses across industries. At AssignmentGPT AI, he leads a team that blends sharp content, strong design, and local insight to turn businesses into brands that connect with people.
Master AI with
AssignmentGPT!
Get exclusive access to insider AI stories, tips and tricks. Sign up to the newsletter and be in the know!

Transform Your Studies with the Power of AssignmentGPT
Empower your academic pursuits with tools to enhance your learning speed and optimize your productivity, enabling you to excel in your studies with greater ease.
Start Your Free Trial ➤Start your success story with Assignment GPT! 🌟 Let's soar! 🚀
Step into the future of writing with our AI-powered platform. Start your free trial today and revolutionize your productivity, saving over 20 hours weekly.
Try For FREE ➤