AssignmentGPT Blogs
When we talk about databases, clarity is everything. Understanding how one thing interacts with the other is important, and that’s where ERDs come in. But what are they?
Entity relationship diagrams (ERDs) are sort of like blueprints. They map out how different pieces of information interact within a database. This guide will take you through the process of how to create ER diagram.
Quick Summary
In this blog, we’ll show you how to draw ER model, and provide you with a brief overview of its elements.
What is a Sample Entity Relationship Diagram?
Imagine a movie. How every element is interconnected with each other. Similarly, an ERD portrays how each character is connected with each other – but a graphical presentation of it.
Entities in a database can be people, objects or concepts. They’re connected by relationships. You can think of ERD as a roadmap that guides you through these connections, serving as an invaluable tool for designing systems.
So, nothing here will end up getting lost in the data web – rather it will exist in a structured manner. This is preventable when you know how to draw ER diagram.
Why Make an Entity Relationship Diagram?
Creating an ERD is basically making a foundation for your data. With an ERD, you can:
- Simplify complex data relationships.
- Communicate the database structure effectively with developers, designers and users.
- Put up a clear, logical representation of how data moves and interacts.
- Make sure that every part of the system is accounted for before construction begins.
Also read this article : Best Diagram Software Tools
Components of an ER Diagram
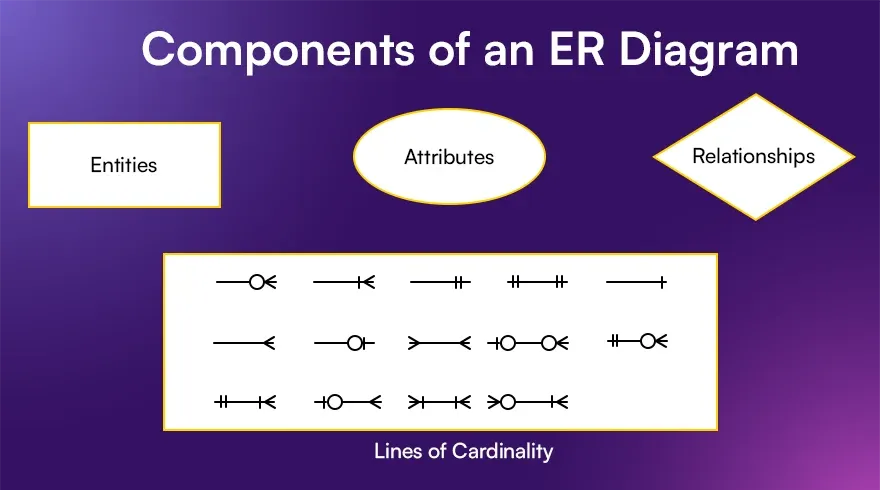
To craft an ERD, you need to become familiar with its building blocks. Here’s what makes an ERD:
1. Entities
Entities are the core characters of your database – rectangles represent them. It could be anything – students in a course, products in a retail database, or employees in an organization.
2. Attributes
These are details of each entity. This gives them more dimension. It is represented by ovals. For example, attributes might include a student’s name, age or ID number – basically something that can define an entity.
3. Relationships
Relationships are connectors. They show how entities interact. These connections are further symbolized by diamonds, serving as the glue that binds entities.
For example, a customer may ‘place’ an order or a teacher might ‘teach’ a course.
4. Lines of Cardinality
Cardinality defines the mathematical nature of relationships. It tells the story of ‘how many.’ Is it one-to-one, one-to-many or many-to-many?
For example, once bank can have multiple branches, while one branch can serve many customers. Crow’s feet notation helps in visualizing these details.
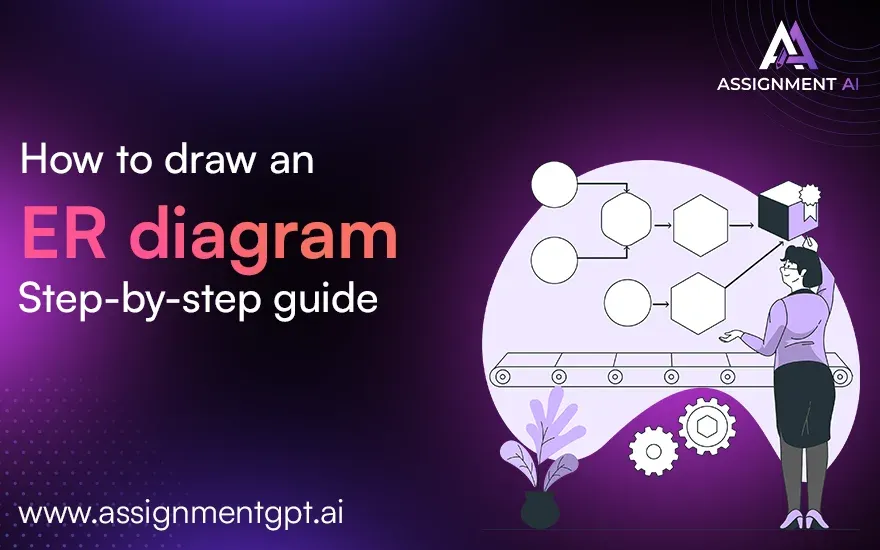
How to draw an ER diagram: Step-by-step guide
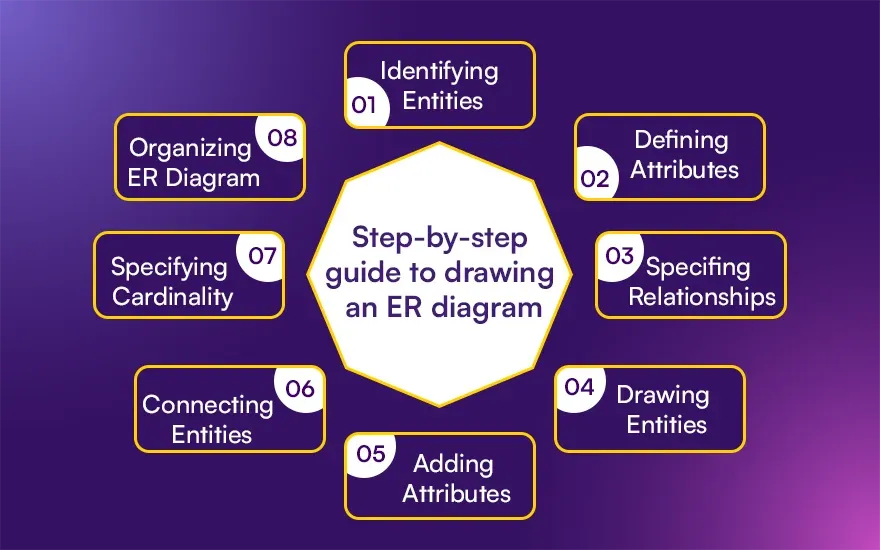
Here’s how you can draw an ER diagram, going step-by-step.
Step 1: Identifying Entities
Let’s take the example of a movie again. The first step would be to name your characters if you’re writing a script.
Do the same here. Assign an identity to each of your components.
Step 2: Defining Attributes
Then, go on to make it a tad bit more specific. Define the traits/attributes of a character. For example, a student entity might have attributes like student ID, name and age.
This gives a trait to each entity, helping you understand and differentiate them.
Step 3: Specifying Relationships
Relationships are interactions between your entities. Like verbs in a sentence, relationships define how entities are connected.
For example, students enroll in courses, or employees work at branches.
Step 4: Drawing Entities
This is the first visualizing task. Now, you start by sketching rectangles for each entity. Label each one clearly, it’s just like giving names to your main characters.
Read More : Entity Relationship Diagrams in DBMS
Step 5: Adding Attributes
Next, move on to draw traits. Attach attributes to each entity using ovals. Make sure that each entity has the right amount of detail to fully describe it.
Step 6: Connecting Entities
In this step, you have to draw lines and connect the related entities. Each connection represents how these entities interact with one another.
This helps in making relationships visible and understandable.
Step 7: Specifying Cardinality
Add another layer of richness by specifying the cardinality of each relationship. Using notations like crow’s feet, illustrate how many instances of one entity can relate to another.
For example, many students can enroll in one course, while one instructor can teach many courses.
Step 8: Organizing ER Diagram
The last step is to arrange your masterpiece. An artist ensures the balance of shapes and colors on a canvas. Organize your entities, attributes and relationships in a clear, lucid manner.
This makes your diagram not only accurate but also aesthetically pleasing.
Conclusion
Creating an ERD is both a science and an art.
It needs a step-by-step approach, and it should result in a clear data model. Your relationships should be well defined, and your database structure must be logical and efficient.
You can use specialized tools for the same. A tool to draw entity relationship diagram can be found here at AssignmentGPT.
Our tool will help with diagrams designed specifically for you!
FAQs
1. What is the difference between an entity and an attribute in an ER diagram?
2. What’s the purpose of cardinality?
3. How does an ER diagram help in database design?
Content writer at @AssignmentGPT
Kandarp’s world is powered by conversations, content, and creativity. With experience across branding, literature, publishing, and strategy, he has helped shape identities and stories for businesses across industries. At AssignmentGPT AI, he leads a team that blends sharp content, strong design, and local insight to turn businesses into brands that connect with people.
Master AI with
AssignmentGPT!
Get exclusive access to insider AI stories, tips and tricks. Sign up to the newsletter and be in the know!

Transform Your Studies with the Power of AssignmentGPT
Empower your academic pursuits with tools to enhance your learning speed and optimize your productivity, enabling you to excel in your studies with greater ease.
Start Your Free Trial ➤Start your success story with Assignment GPT! 🌟 Let's soar! 🚀
Step into the future of writing with our AI-powered platform. Start your free trial today and revolutionize your productivity, saving over 20 hours weekly.
Try For FREE ➤