AssignmentGPT Blogs
Unified Modeling Language (UML) is a standardized modeling language in software engineering. It is typically introduced during formal education. UML diagrams are often neglected in professional environments. This occurs due to their time-intensive creation process. They can quickly become obsolete in Agile frameworks.
Despite these challenges, visual documentation benefits engineering teams substantially. UML diagrams streamline onboarding processes for new personnel. They provide stakeholders with system overviews. They reduce unnecessary meeting time.
Quick Summary
This article reviews UML diagram classifications and their applications comprehensively. Readers will gain insights into:
- The fundamental principles of UML diagrams
- The practical utility of UML in software development cycles
- Various uml diagram types and their specific implementations
- Template examples for common use cases
- Best practices for UML implementation in modern development environments
The following sections explore these topics in detail. They offer information for both newcomers and experienced practitioners. This helps enhance documentation methodologies effectively.
What are UML diagrams?
UML (Unified Modeling Language) diagrams are standardized visual representations used to design, document, and communicate software systems. They provide a common language for software architects, developers, and stakeholders to understand system structure and behavior.
Why should you use UML diagrams?
You should use UML diagrams because they:
- Facilitate clear communication among team members
- Help identify potential design flaws early in development
- Provide documentation that remains valuable throughout the project lifecycle
- Simplify complex systems through visual abstraction
- Support both high-level system overviews and detailed component specifications
Types of UML diagrams
UML diagrams are divided into two main categories - Structural diagrams and Behavioral diagrams.
Structural diagrams : focus on the static aspects of a system. They illustrate the elements that must be present in the system and how they relate to each other. These diagrams emphasize what things must exist in the system being modeled.
Behavioral diagrams : on the other hand, focus on the dynamic aspects of a system. They show how the system responds to events, how it changes over time, and the interactions between different system components. These diagrams emphasize what must happen in the system being modeled.
1. Structure Diagrams
Class Diagram
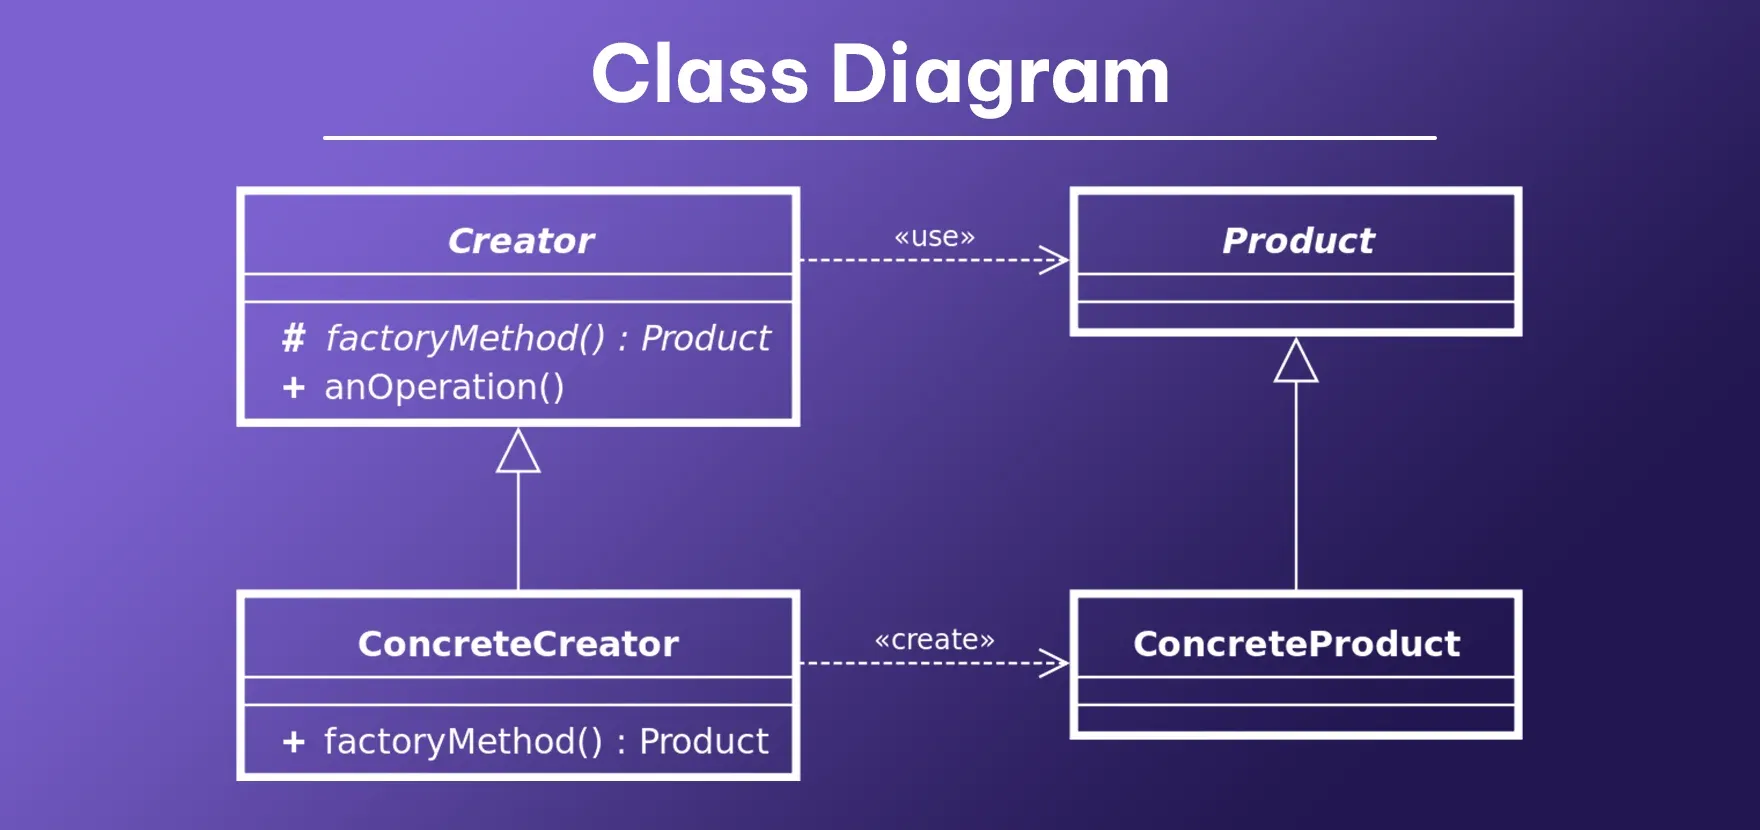
Class diagrams are the backbone of object-oriented modeling, representing the static structure of a system. They depict classes, their attributes, operations (or methods), and the relationships among objects. Each class is represented as a rectangle divided into three parts: the class name, attributes, and operations. The diagram clearly shows inheritance relationships (generalization/specialization), associations, aggregations, compositions, and dependencies between classes. Class diagrams help developers understand the architecture of a system before writing any code, ensuring proper object-oriented design principles are followed.
Use cases
- Designing object-oriented systems and establishing class hierarchies
- Mapping out database schemas and entity relationships
- Communicating system architecture to development teams
- Forward engineering (generating code from visual models)
- Reverse engineering (creating models from existing code)
- Documentation for maintenance and onboarding
Component Diagram
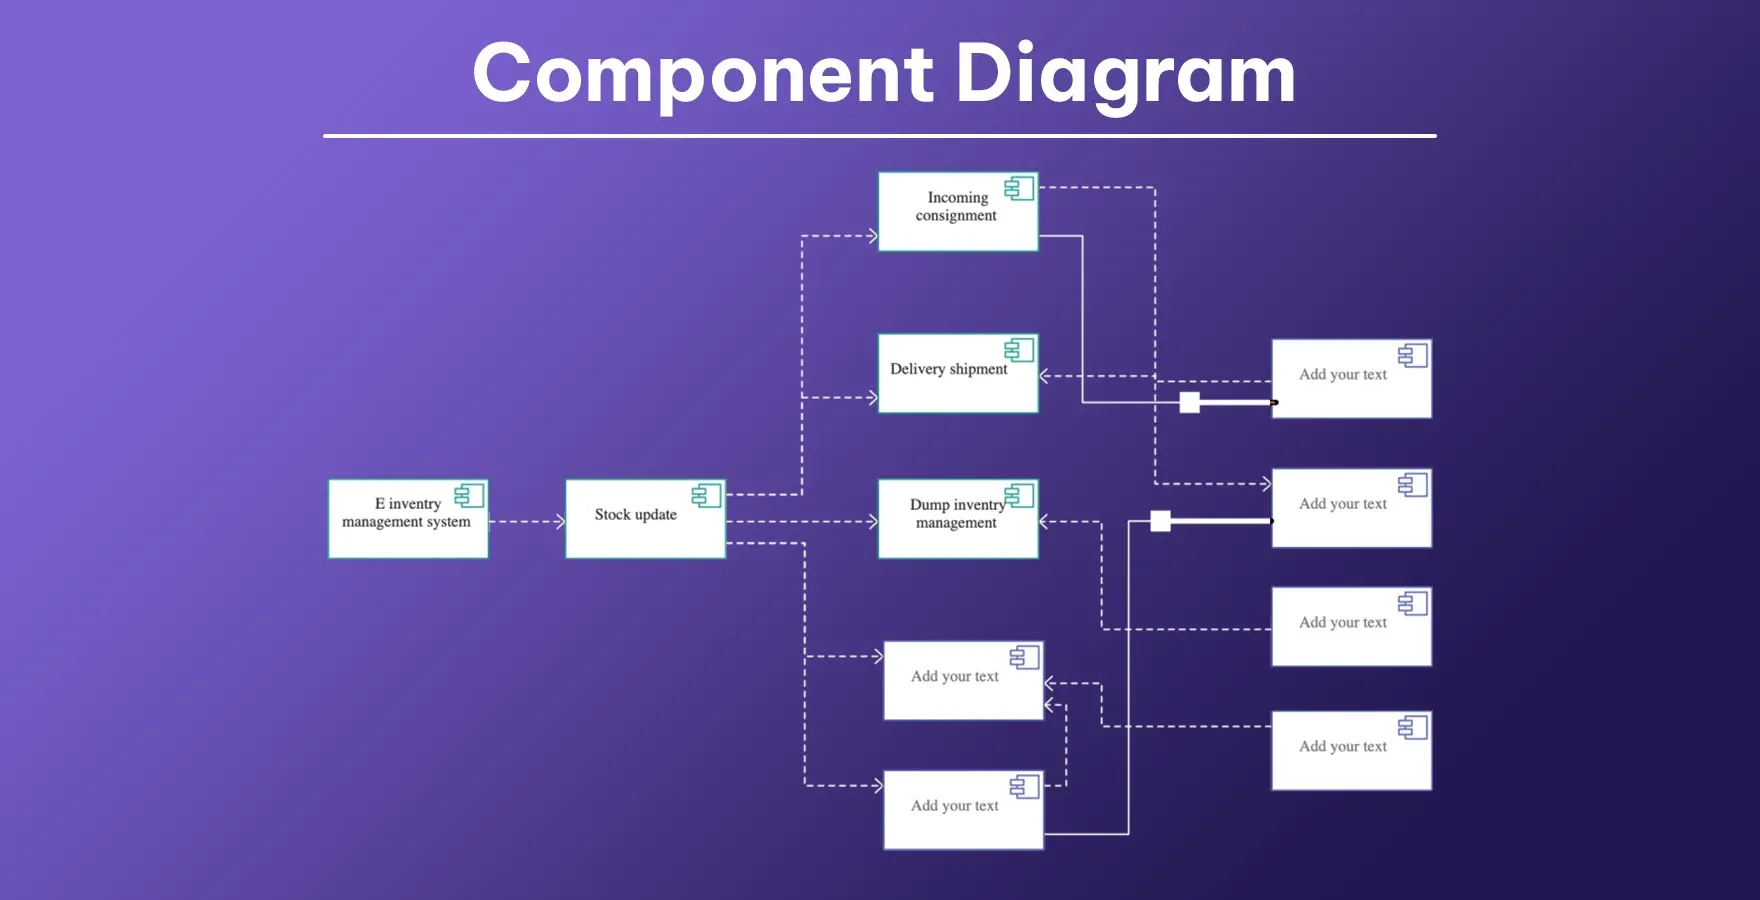
Component diagrams illustrate how components are wired together to form larger components or software systems. These diagrams focus on the components of a system, their interfaces, and their relationships. Components represent modular parts of a system with well-defined interfaces that can be replaced or reused. The diagram typically shows provided and required interfaces, ports, and how various components connect to create the system architecture. Component diagrams are particularly valuable in large systems where understanding the high-level structure and dependencies between major components is crucial for maintenance and development.
Use cases
- Visualizing high-level system architecture and major components
- Planning service-oriented architectures and microservices
- Identifying opportunities for component reuse across projects
- Clarifying dependencies between system modules
- Explaining system interfaces to non-technical stakeholders
- Planning component replacement strategies
Deployment Diagram
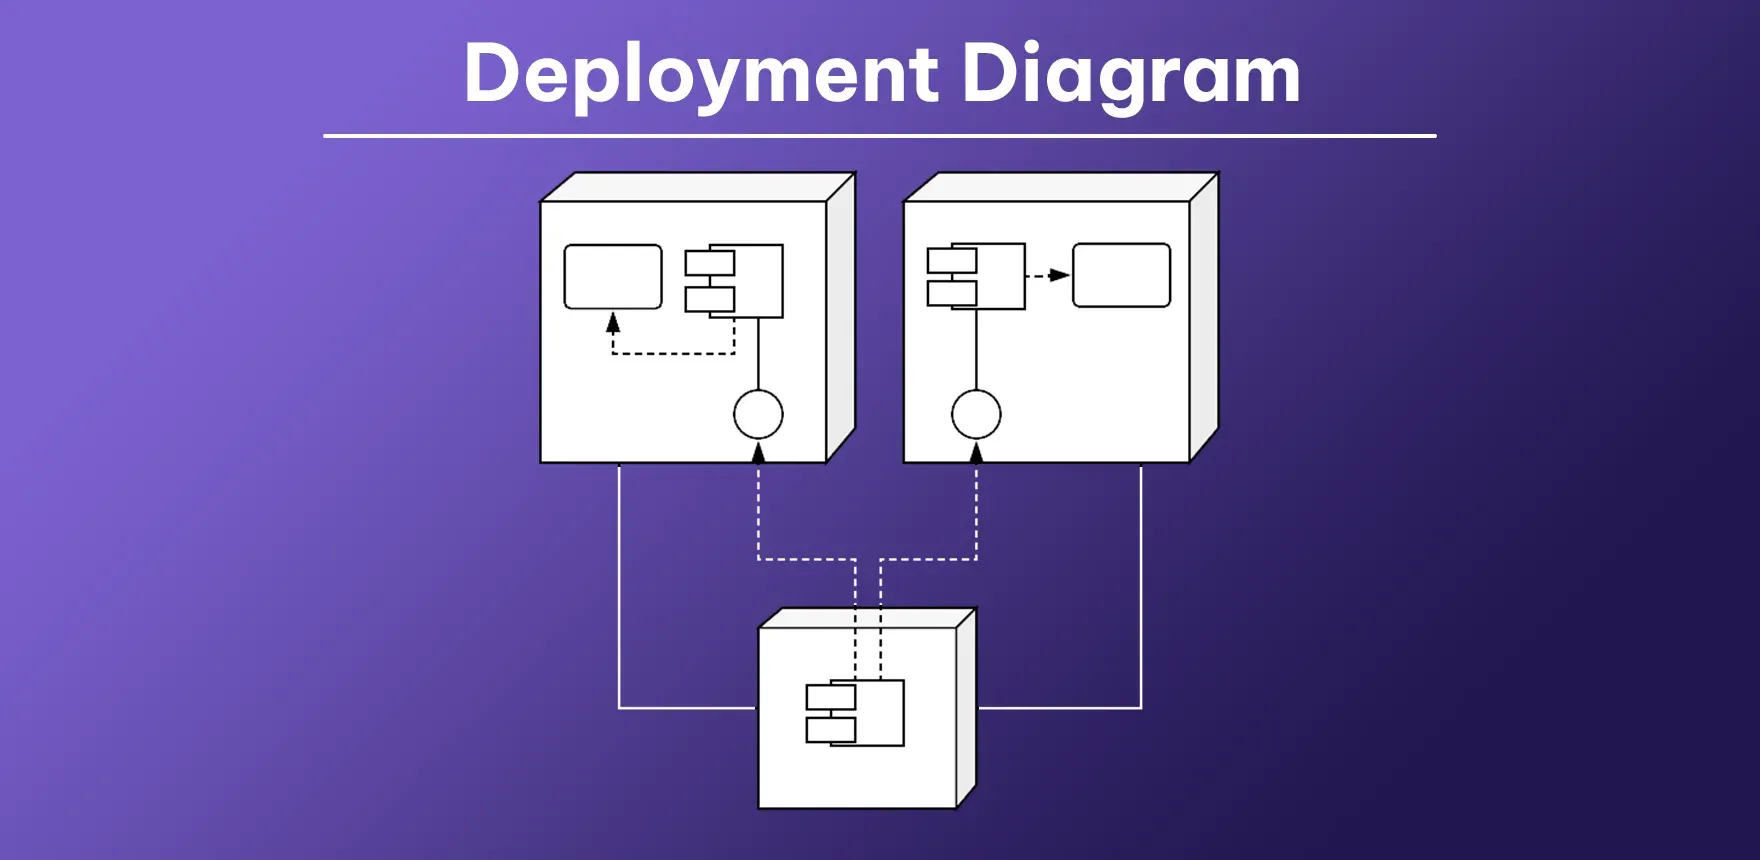
Deployment diagrams model the physical deployment of artifacts on nodes within a system's hardware environment. These diagrams map the software architecture to the physical system architecture, showing which hardware components (nodes) exist, what software components (artifacts) are deployed on them, and how they interact. Nodes represent hardware devices or execution environments, while artifacts represent software files, documents, or other physical pieces deployed on nodes. Deployment diagrams help system administrators and developers understand hardware requirements, network configurations, and how the software is distributed across physical infrastructure.
Use cases
- Planning infrastructure requirements and server configurations
- Documenting production environment setup
- Analyzing potential performance bottlenecks before deployment
- Supporting hardware procurement decisions
- Planning cloud resource allocation
- Documenting network configurations and security zones
Composite Structure Diagram
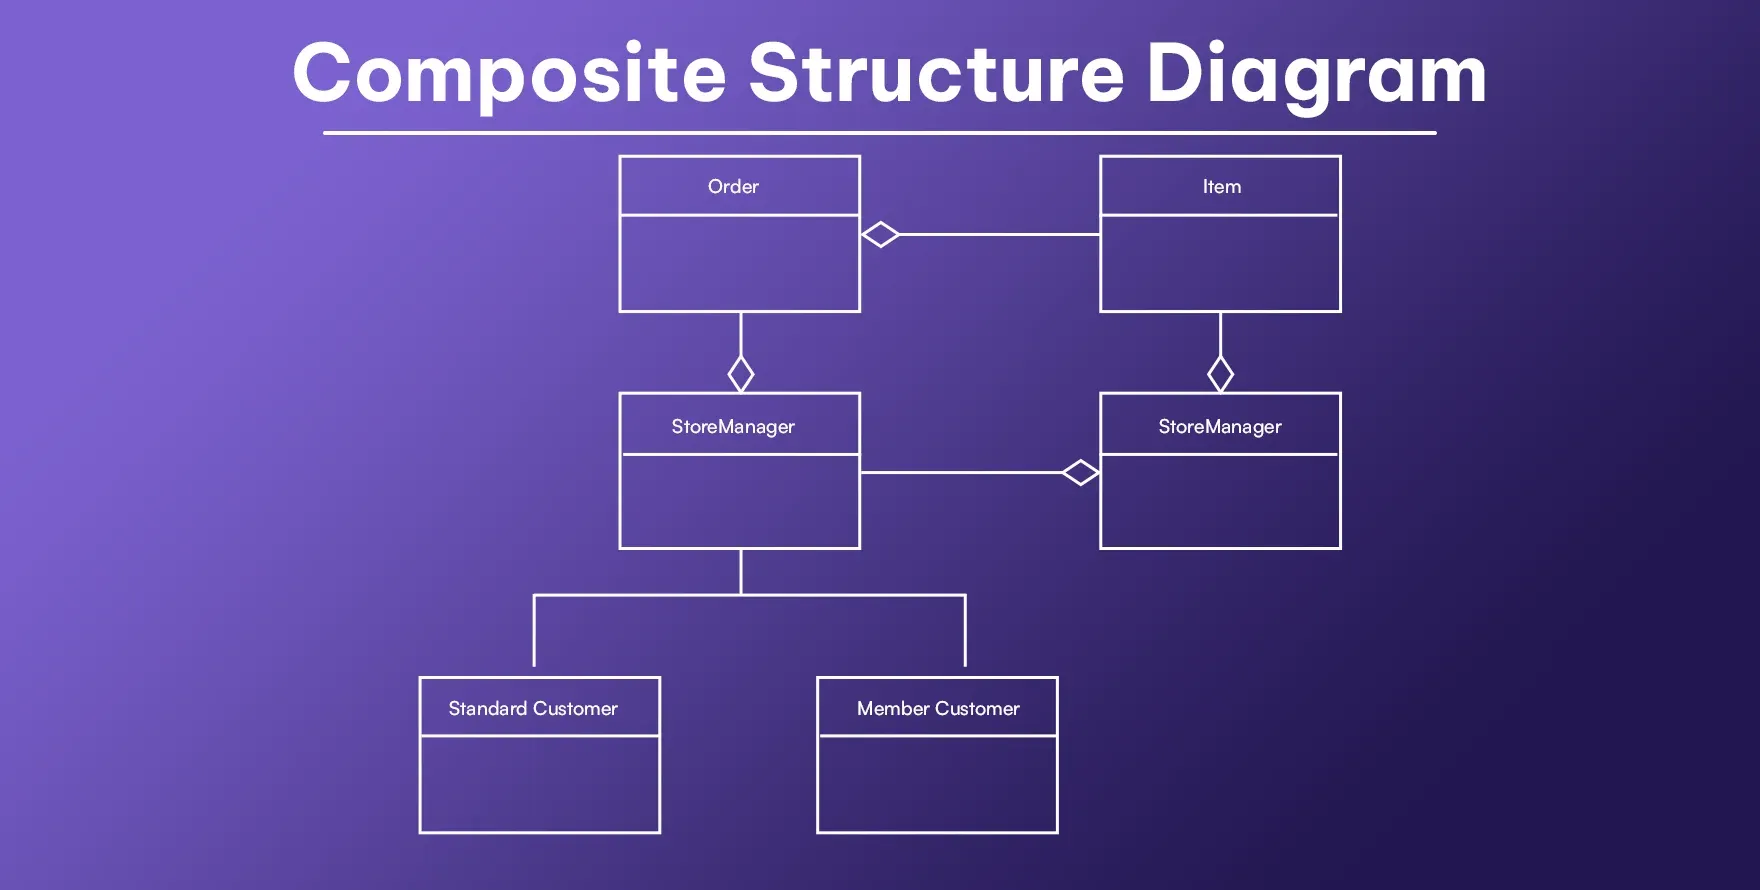
Composite structure diagrams show the internal structure of a class and the interactions between various parts that compose it. Unlike class diagrams that focus on static class relationships, composite structure diagrams emphasize the runtime architecture and collaboration between instances. They reveal the internal parts of complex classifiers and their interconnections, ports through which parts interact with each other, and how these elements collaborate to achieve the behavior of the containing classifier. These diagrams are particularly useful for modeling complex systems with recursive or deeply nested components.
Use cases
- Modeling complex classes with numerous internal collaborating parts
- Visualizing runtime collaborations between system elements
- Designing frameworks with deeply nested components
- Specifying internal structures of complex components
- Modeling systems where components have dynamic internal relationships
- Documenting component interactions at runtime
Object Diagram
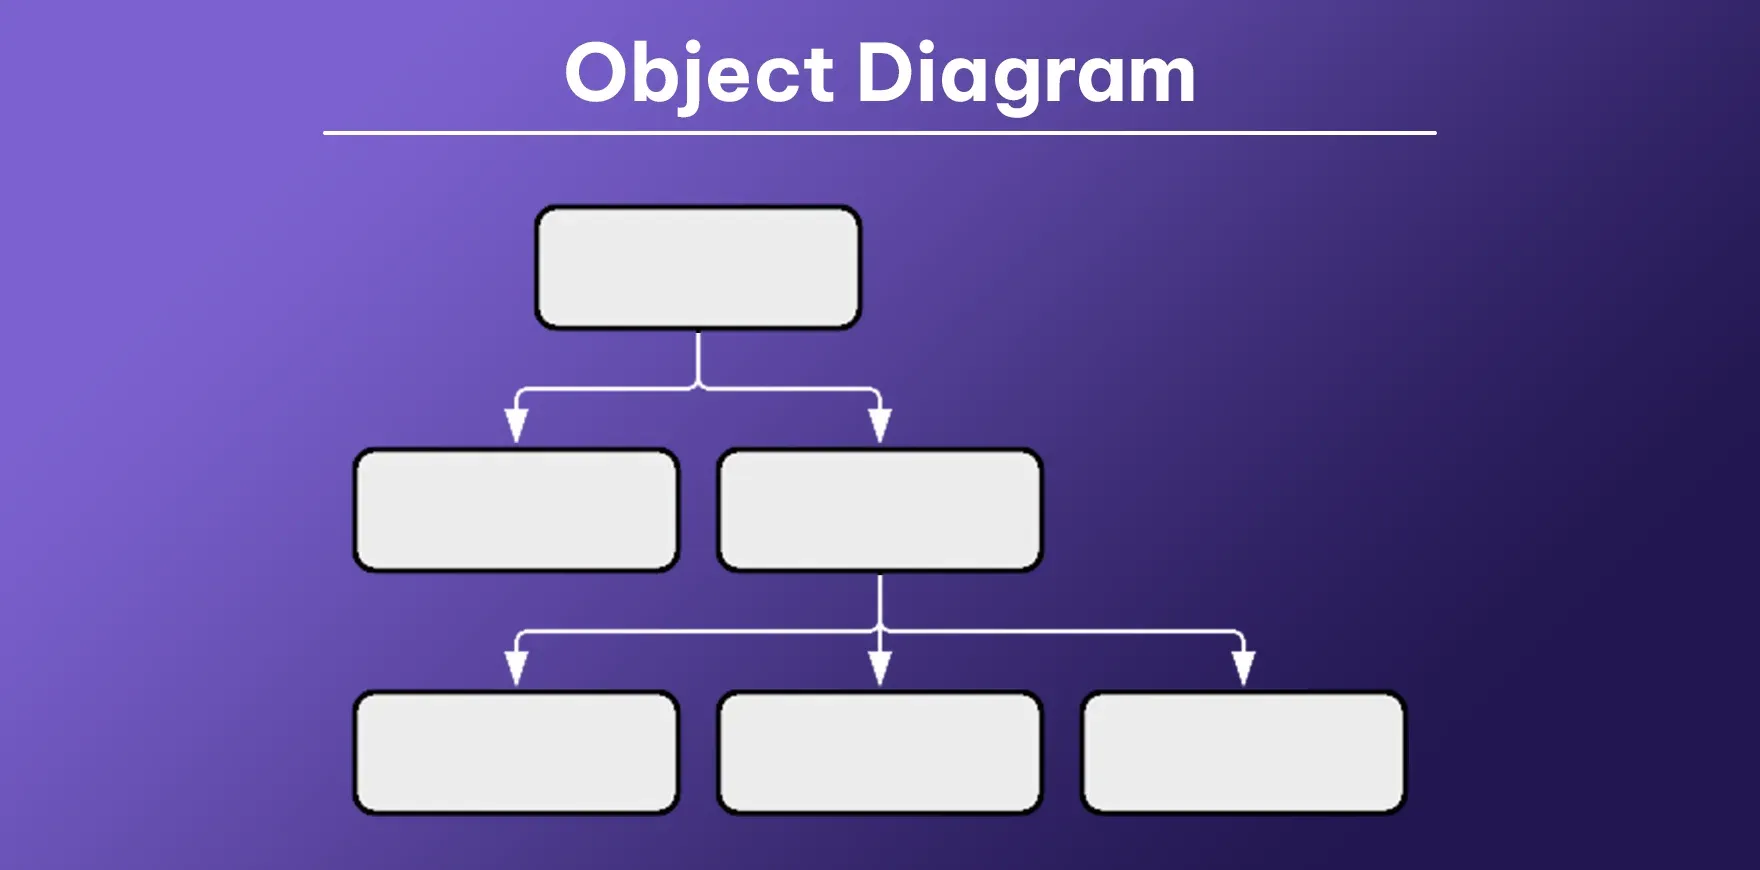
Object diagrams provide concrete examples of class diagrams by showing snapshots of instances of classes at a particular moment. While class diagrams show all possible relationships, object diagrams depict specific instances with actual values for attributes, making abstract concepts more tangible. They represent a frozen moment in time, displaying specific states of a system during execution. Object diagrams are excellent tools for validating class diagrams, illustrating complex relationships with real examples, and testing specific scenarios. They bridge the gap between conceptual design and actual implementation by showing how objects are related and instantiated in real-world scenarios.
Use cases
- Providing concrete examples of abstract class relationships
- Validating class diagrams with specific instances
- Illustrating complex relationships with actual values
- Testing specific scenarios with example objects
- Explaining designs to non-technical stakeholders
- Documenting specific system states for debugging
Package Diagram
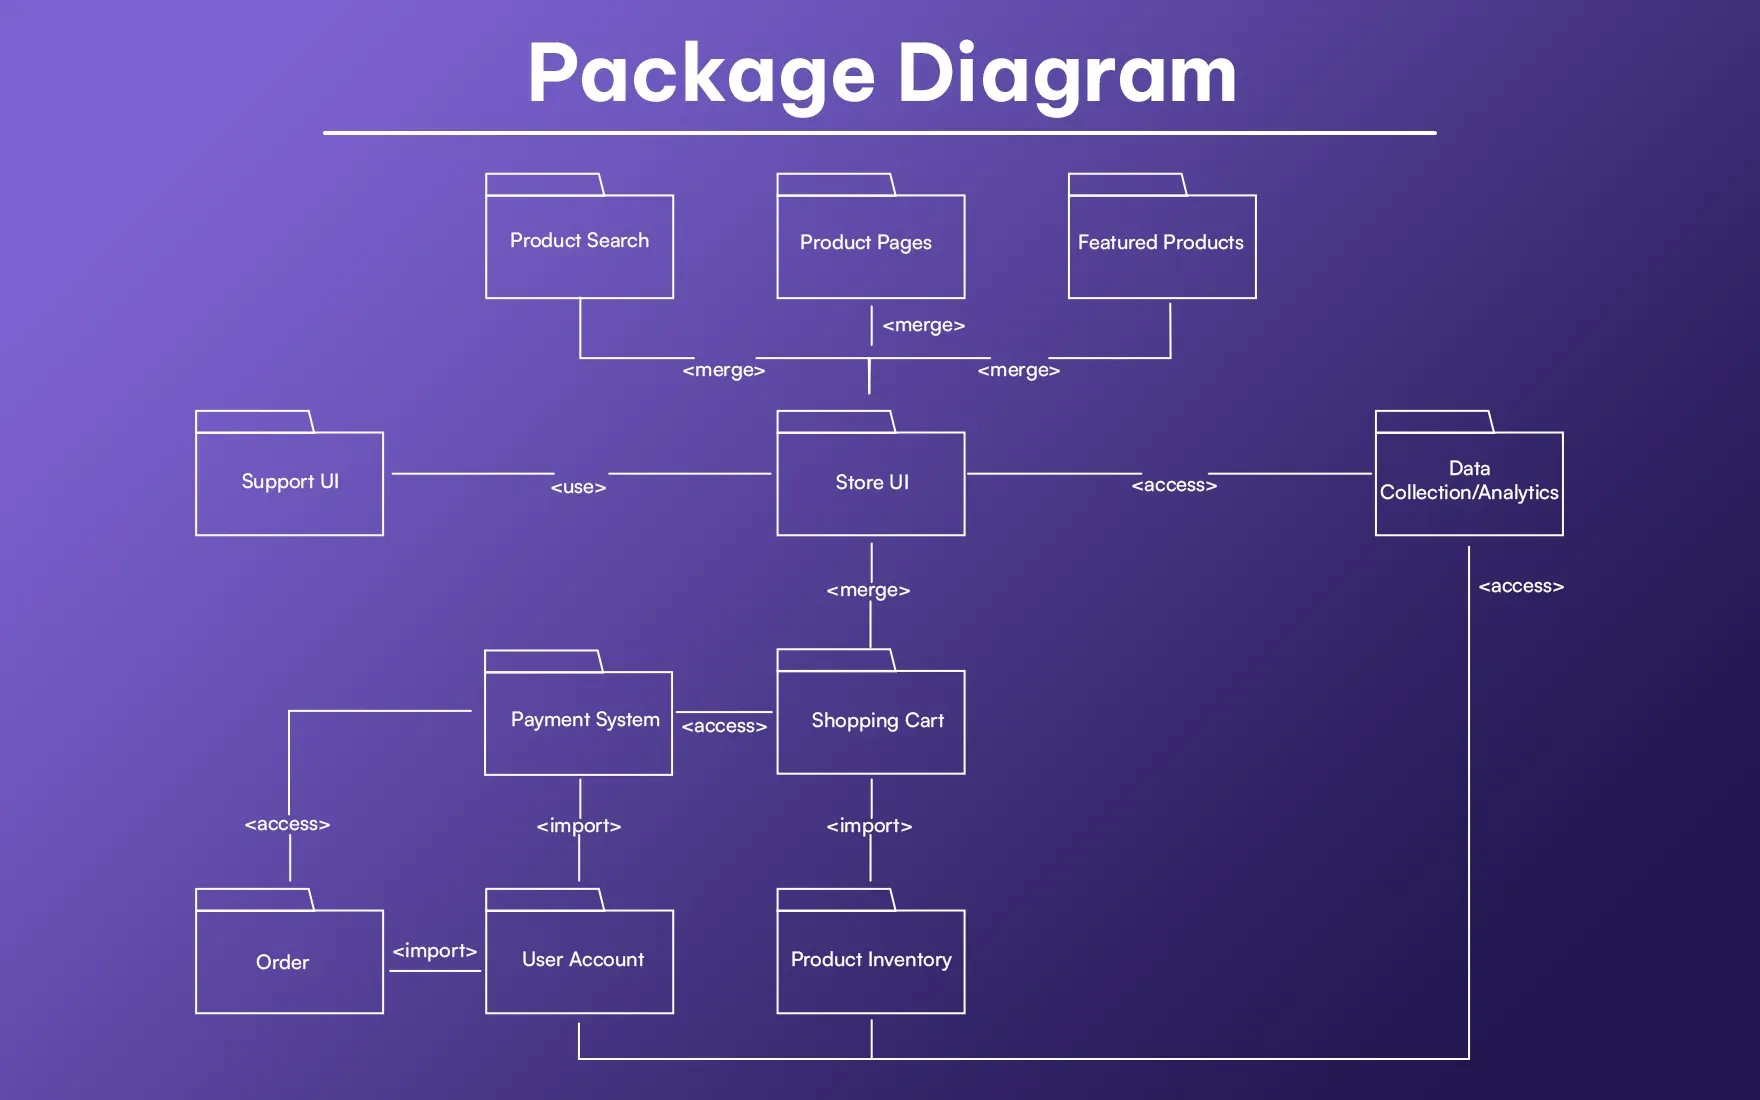
Package diagrams organize elements of a system into related groups (packages), showing the dependencies between these packages at a high level. Packages are represented as file folders and serve to group related elements together, providing a namespace for the grouped elements. These diagrams help manage complexity in large systems by organizing classes, components, and other UML elements into cohesive units. Package diagrams illustrate the system architecture at a macro level, showing module dependencies, import relationships, and hierarchical structures of packages. They're instrumental in planning software architecture, defining namespaces, and managing development work across teams.
Use cases
- Organizing large codebases into logical modules
- Planning modular architectures and namespace definitions
- Visualizing dependencies between system modules
- Planning work distribution across development teams
- Identifying dependency issues during system refactoring
- Establishing high-level organization in complex systems
Profile Diagram
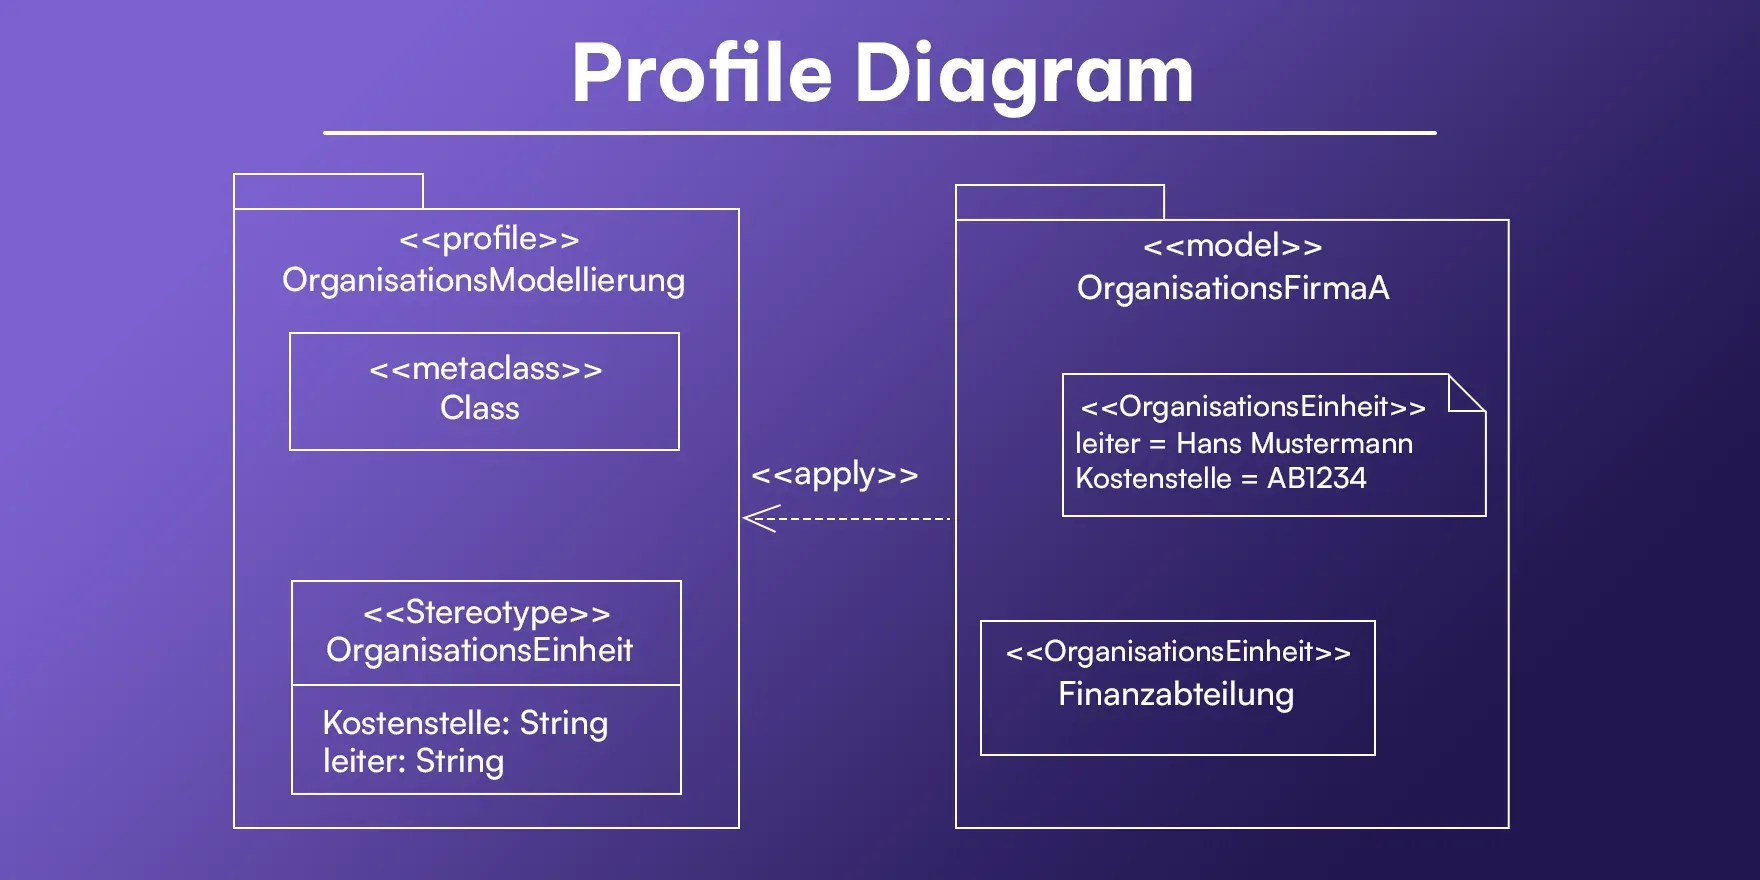
Profile diagrams extend the UML metamodel to accommodate domain-specific concepts and notations. They allow UML to be customized for particular industries, platforms, or methodologies without changing the core UML meta-model. Profiles define stereotypes (custom UML elements), tagged values (additional properties), and constraints that tailor UML for specific contexts. For example, a profile might extend UML for real-time systems, web applications, or specific programming languages like Java or C#. Profile diagrams enable organizations to create domain-specific modeling languages based on UML, ensuring consistency while addressing specialized needs that standard UML might not adequately cover.
Use cases
- Extending UML for domain-specific modeling needs
- Creating custom modeling elements for specialized industries
- Adapting UML for specific platforms or frameworks
- Defining constraints and rules for specialized models
- Developing domain-specific modeling languages
- Standardizing modeling approaches across organizations
Also read this article : Best 7 UML Sequence Diagram Tools for Easy Visualization
2. Behavioral Diagrams
Use Case Diagram
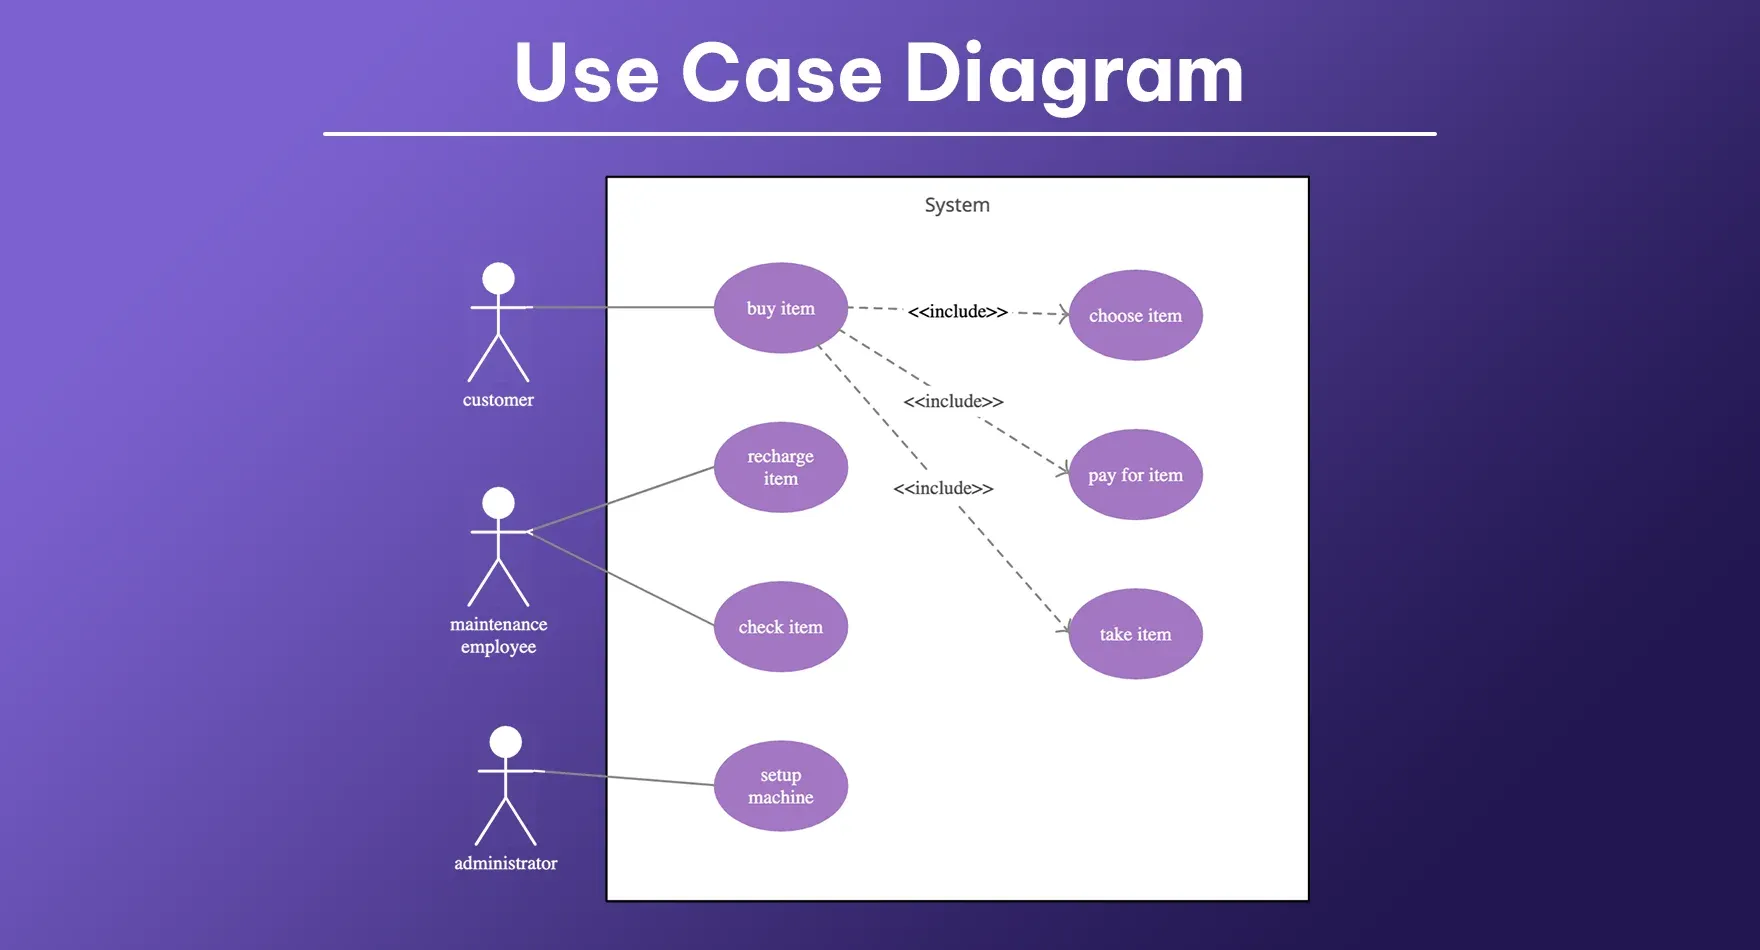
Use case diagrams visualize the functional requirements of a system from an external perspective, showing how users (actors) interact with the system to achieve specific goals. Actors represent roles that users or external systems play when interacting with the system, while use cases represent specific functionalities the system provides. These diagrams define the system boundaries, illustrate relationships between actors and use cases, and show dependencies between use cases (through include, extend, and generalization relationships). Use case diagrams serve as communication tools between stakeholders, helping to establish a common understanding of system requirements before diving into technical details. They focus on what the system does rather than how it does it, making them accessible to non-technical stakeholders.
Use cases
- Gathering and documenting functional requirements
- Defining system boundaries and scope
- Communicating with non-technical stakeholders
- Planning system functionality from a user perspective
- Identifying actors and their roles in the system
- Establishing relationships between different system functions
Sequence Diagram
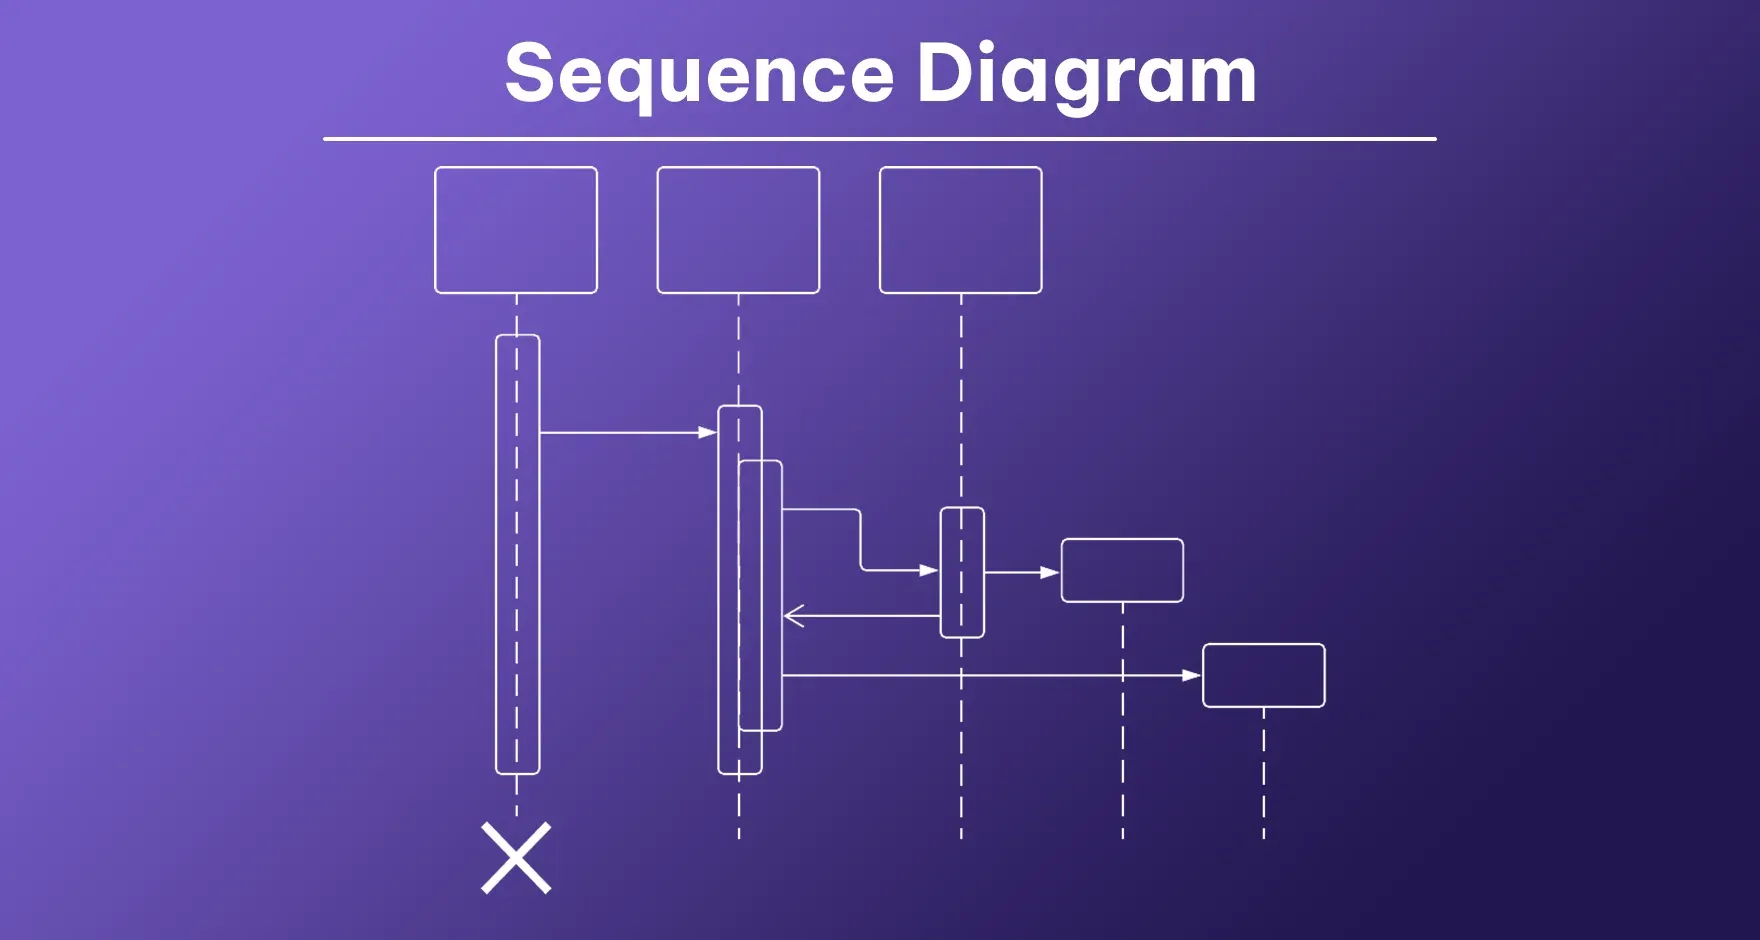
Sequence diagrams illustrate how objects interact with each other over time to complete a process or operation. They emphasize the time-ordered sequence of messages between objects, showing which operations are called, in what order, and how long each operation takes. The vertical dimension represents time progression, while the horizontal dimension shows the objects participating in the interaction. Lifelines extend vertically from each object, with activation boxes indicating when an object is active in a process. Messages are shown as arrows between lifelines, representing method calls or signals. Sequence diagrams are invaluable for modeling complex object interactions, designing system algorithms, documenting communication protocols, and validating use case specifications by showing the detailed flow of execution.
Use cases
- Modeling message flows between objects over time
- Designing object interactions and communication protocols
- Documenting API call sequences
- Validating use case implementations
- Troubleshooting complex interaction issues
- Specifying timing requirements for operations
Activity Diagram
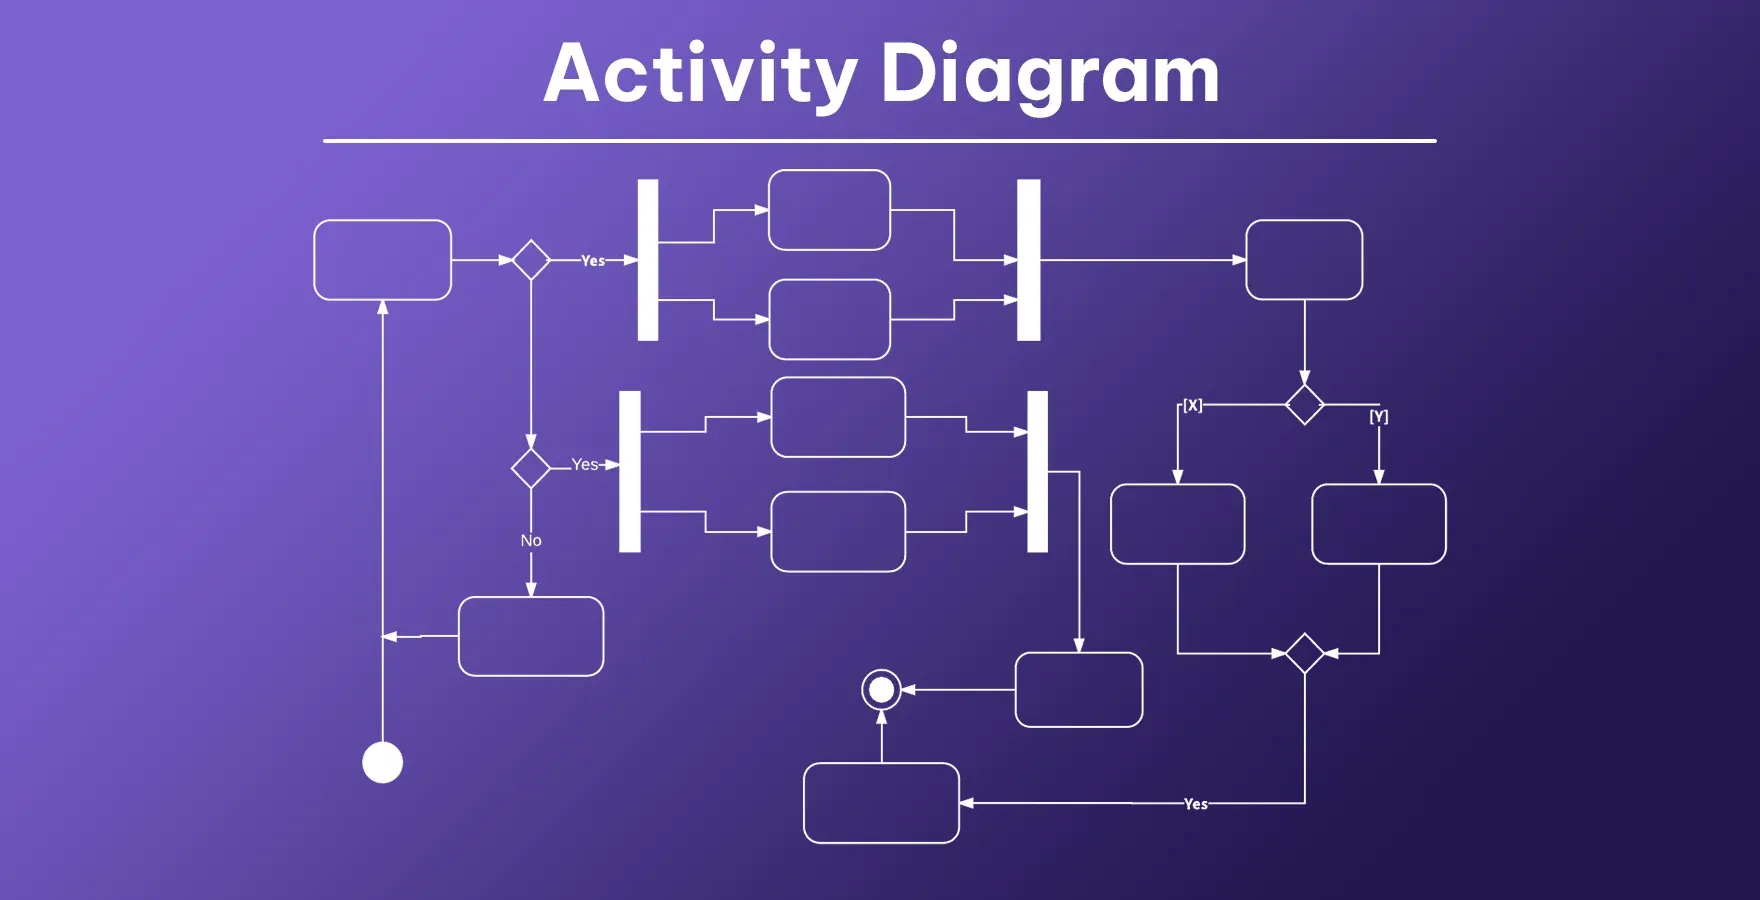
Activity diagrams represent workflows, business processes, and algorithmic flows in a system. They model both sequential and concurrent activities, showing the flow of control from one activity to another. These diagrams include special notations for decisions, merges, forks (parallel paths), and joins (synchronization points), making them ideal for illustrating complex logic with multiple branching possibilities. Activities are represented as rounded rectangles, connected by transitions (arrows) showing the flow. Decision points are shown as diamonds with multiple outgoing paths labeled with guard conditions. Activity diagrams can be partitioned into swimlanes to show which person or department is responsible for specific activities, making them particularly useful for business process modeling and documentation.
Use cases
- Modeling business processes and workflows
- Visualizing algorithms with multiple decision paths
- Documenting procedures spanning multiple departments
- Designing parallel processing logic
- Modeling complex user interactions
- Mapping exception handling processes
Timing Diagram
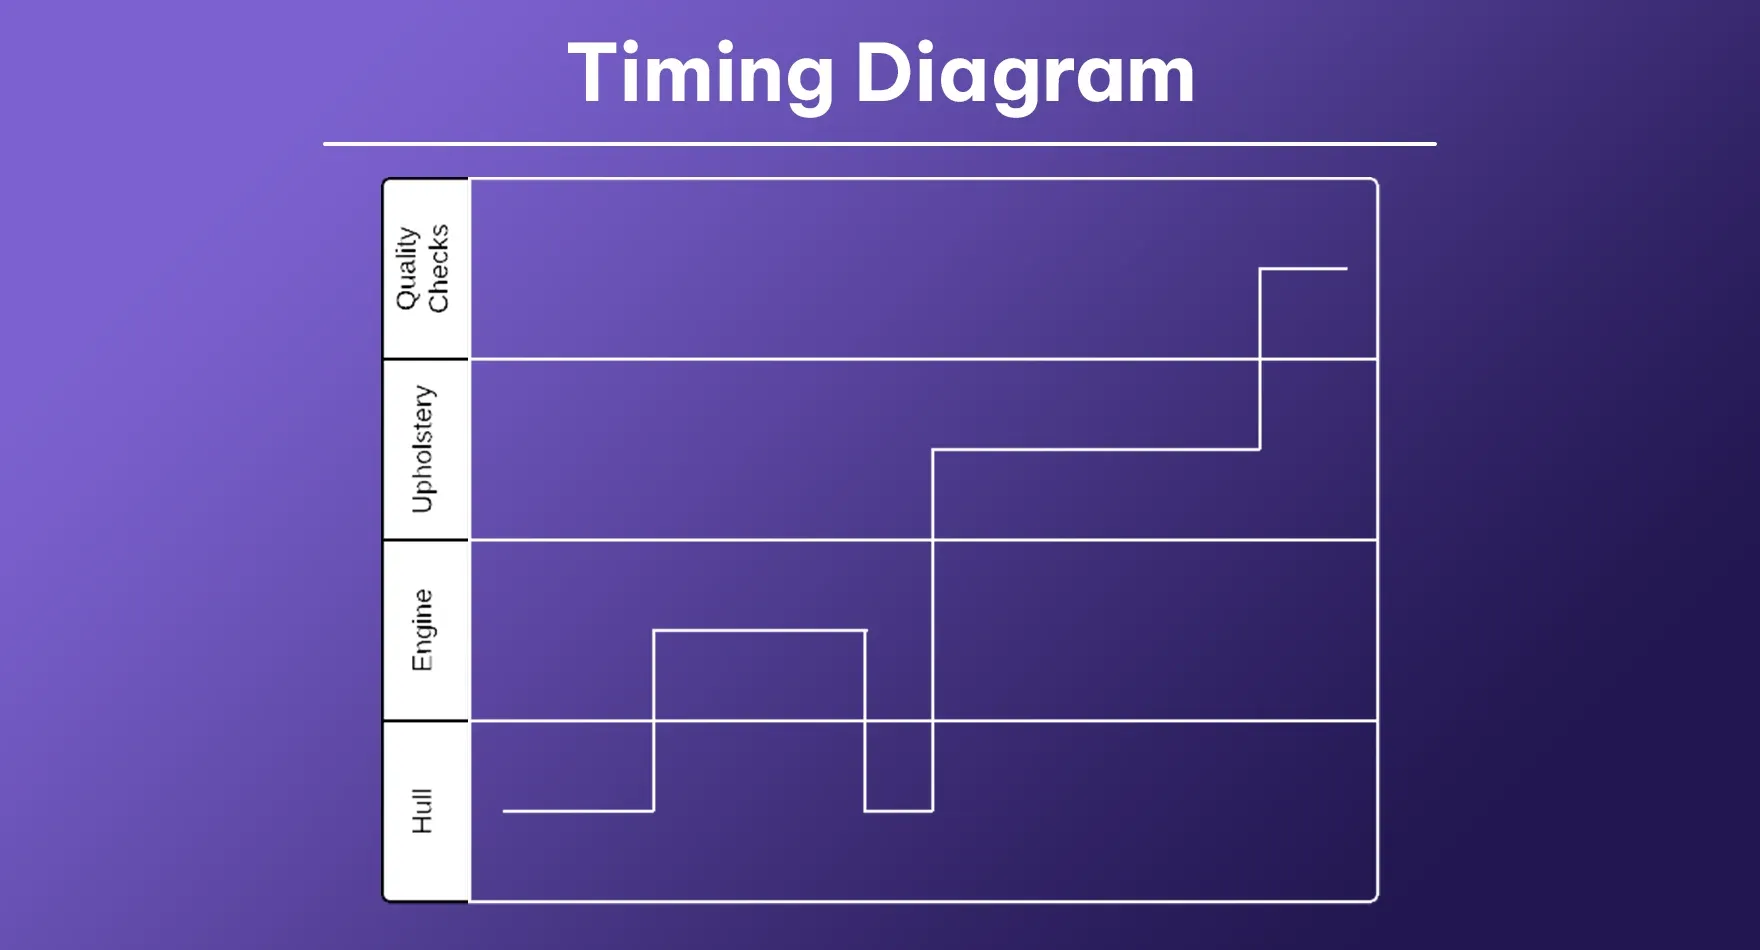
Timing diagrams focus on timing constraints and temporal relationships between different objects or processes in a system. They are a specialized form of interaction diagram that shows state changes and interactions of objects along a time axis. The horizontal axis represents time progression, while the vertical axis typically shows different states of an object or different objects. Timing diagrams are particularly useful in real-time and embedded systems where precise timing of operations is critical. They help visualize state changes over time, timing constraints between events, and timing-related requirements. These diagrams can reveal timing issues, race conditions, and performance bottlenecks before implementation, ensuring that time-critical systems meet their timing requirements.
Use cases
- Designing real-time and embedded systems
- Identifying race conditions and timing constraints
- Visualizing state changes over precise time periods
- Analyzing performance bottlenecks
- Documenting timing requirements for operations
- Modeling time-critical interactions between components
Communication Diagram
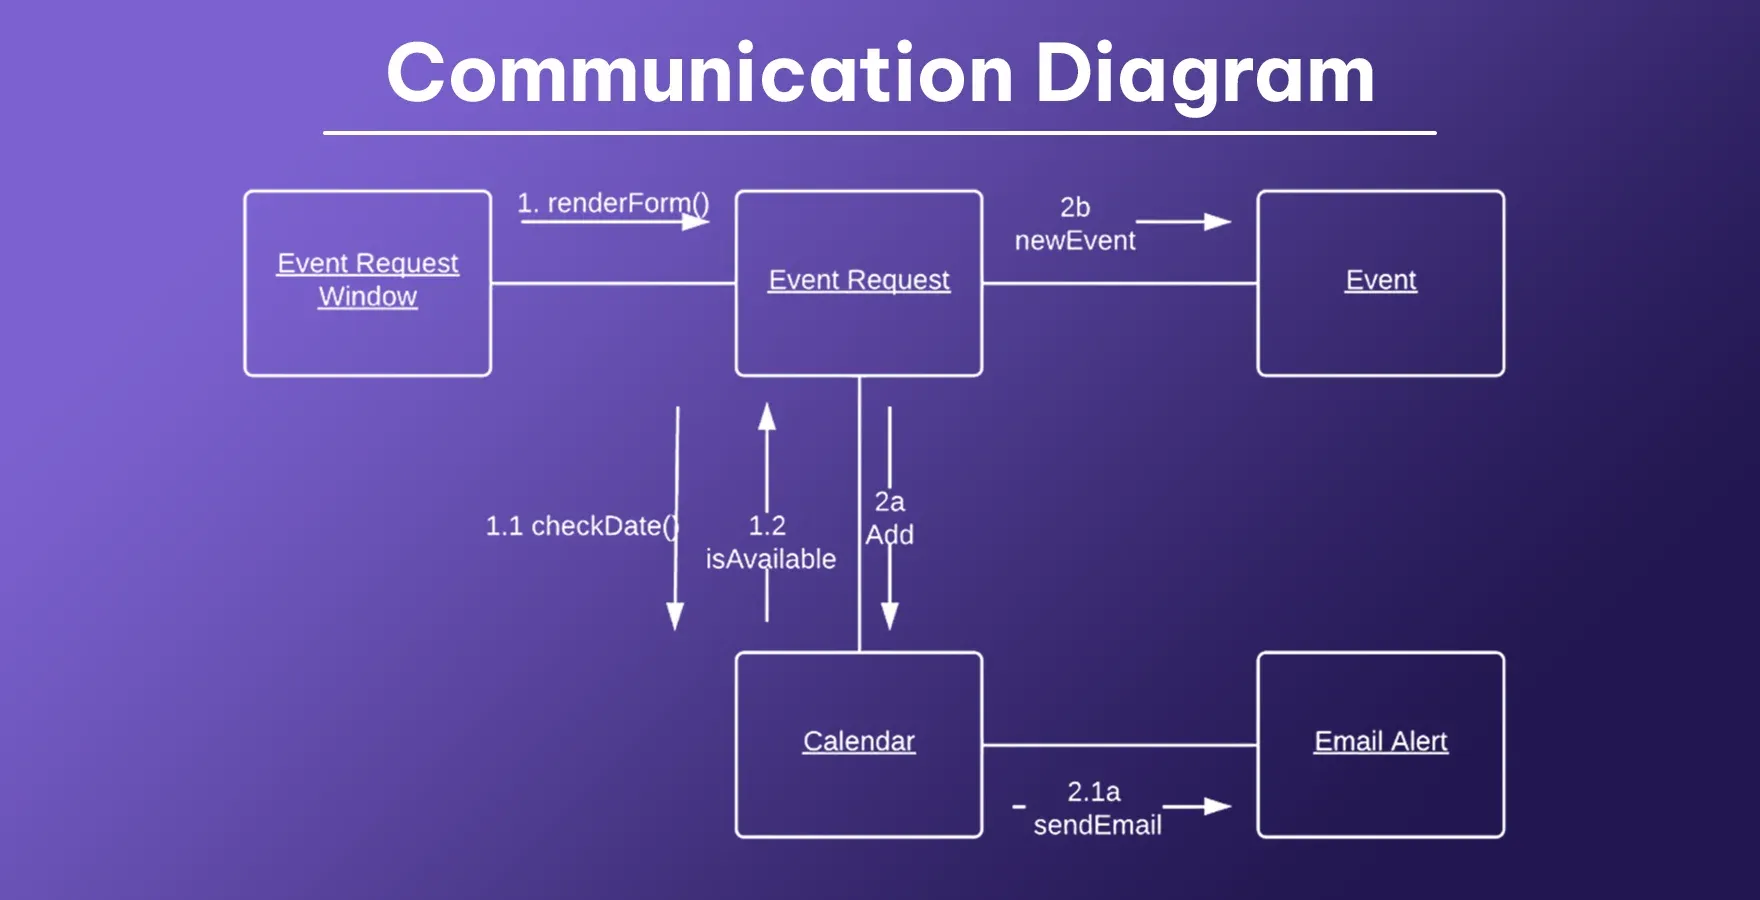
Communication diagrams (formerly known as collaboration diagrams in UML 1.x) model the interactions between objects or parts of a system, emphasizing the relationships between the objects rather than the time sequence. They show similar information as sequence diagrams but organize it differently, focusing on the structural links between objects and the messages they exchange. Objects are shown as rectangles connected by association lines, with messages depicted as labeled arrows along these lines. Sequence numbers indicate the order of messages. Communication diagrams are particularly useful when the emphasis is on understanding which objects communicate with each other and the network of relationships, rather than the precise timing of interactions.
Use cases
- Analyzing object interaction networks
- Identifying central communication objects in a system
- Assessing potential coupling issues between components
- Understanding structural relationships during interactions
- Visualizing message paths between objects
- Simplifying complex interaction patterns
State Diagram
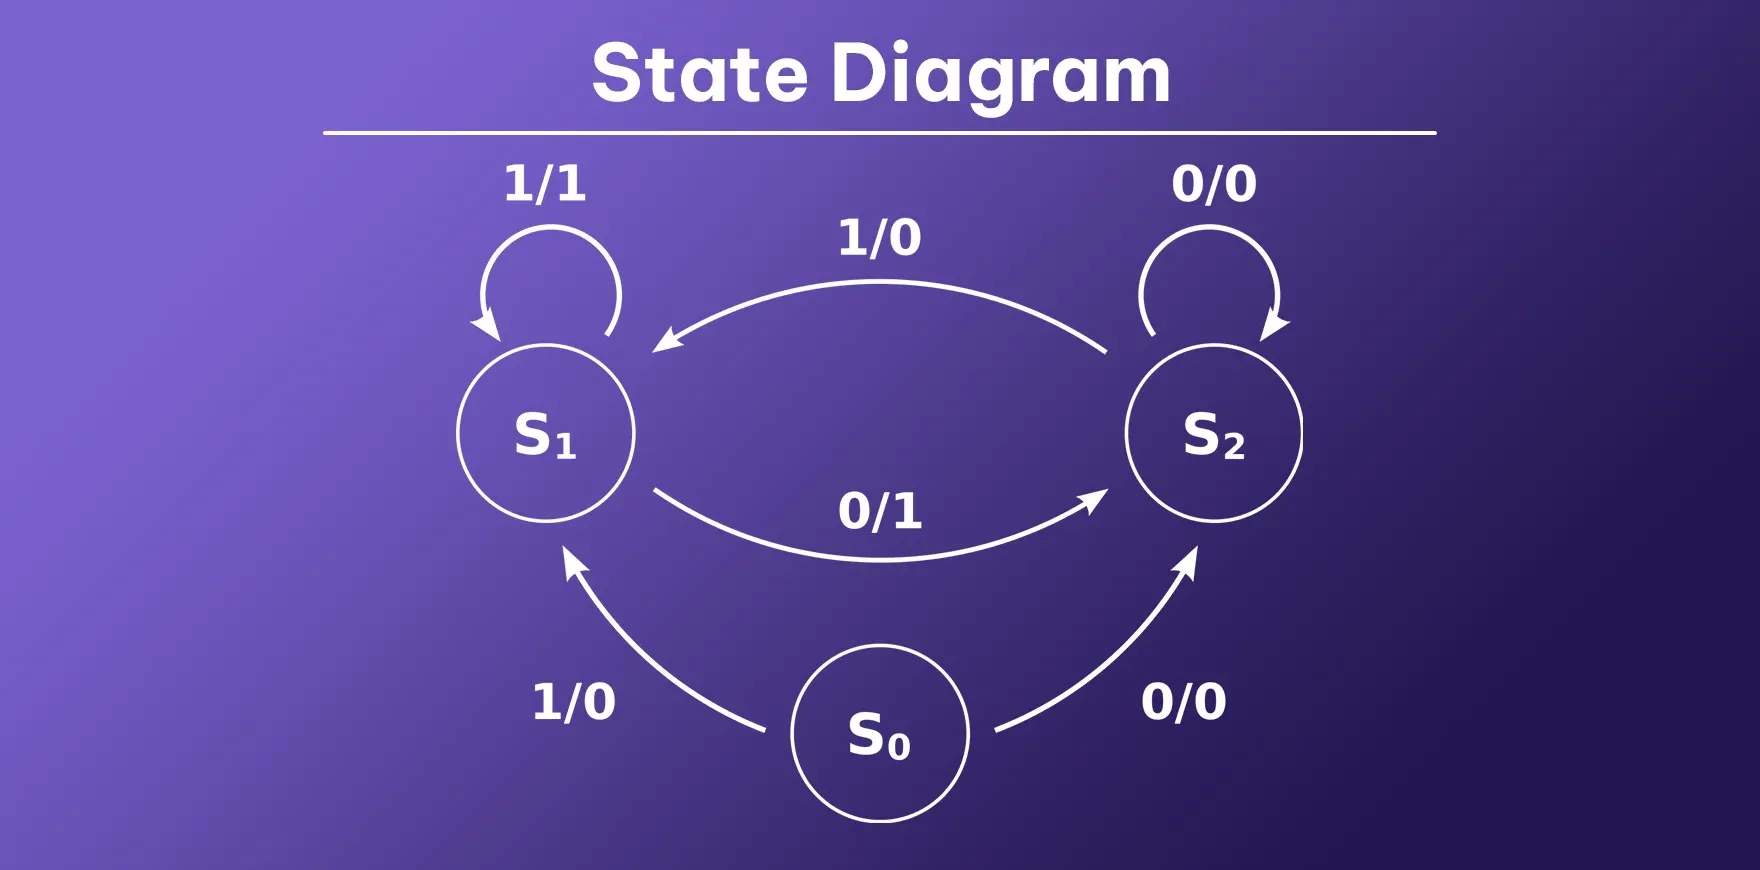
State diagrams (or state machine diagrams) describe the behavior of an object in terms of its states and the transitions between those states in response to events. They show how an object responds to various events depending on its current state, and how it changes state as a result. States are represented as rounded rectangles, while transitions are shown as arrows labeled with the triggering event and any actions that occur during the transition. Special notations exist for initial states, final states, and composite states (which contain nested state machines). State diagrams are especially valuable for modeling reactive systems, control systems, and objects with complex lifecycle behaviors where the response to an event depends on the object's history or current condition.
Use cases
- Modeling objects with complex lifecycles
- Designing state-dependent behavior
- Documenting user session states
- Designing workflow engines and document processors
- Modeling event-driven systems
- Handling complex state transitions in reactive systems
Interaction Overview Diagram
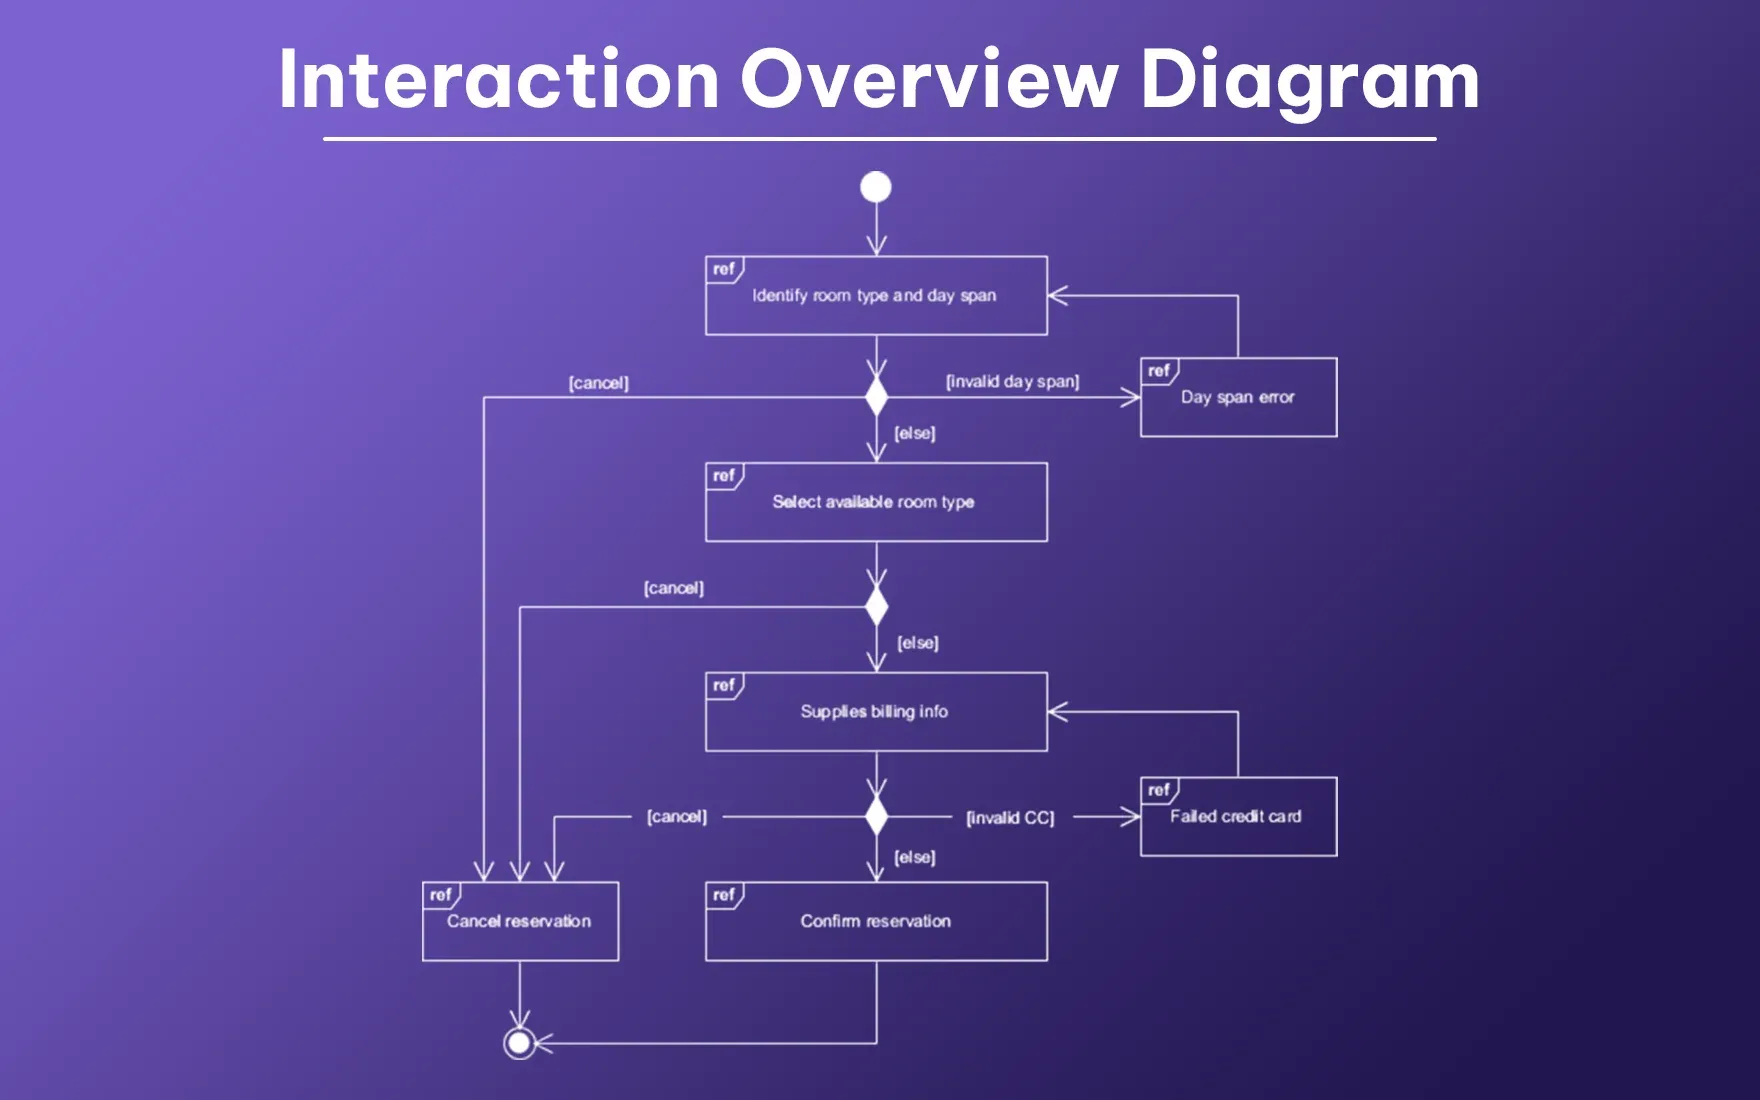
Interaction Overview Diagrams combine elements of activity diagrams and sequence diagrams to provide a high-level view of the control flow through a system, with the ability to nest interaction diagrams within the activity nodes. They use the frame structure of activity diagrams but replace some activity nodes with interaction fragments (often miniature sequence diagrams). This creates a hierarchical model that shows both the overall flow of control and the detailed interactions at critical points. These diagrams are particularly useful for modeling complex scenarios that involve multiple use cases or interaction instances, providing both the big picture and the detailed interactions in a single view. They help in understanding how different sequence diagrams relate to each other in the overall process flow.
Use cases
- Combining high-level flow with detailed interactions
- Modeling complex scenarios spanning multiple use cases
- Providing both broad and detailed views of system behavior
- Documenting how different sequence diagrams relate to each other
- Modeling alternatives and parallel processes in complex interactions
- Creating hierarchical models of system behavior
Conclusion
UML diagrams are essential for visualizing and designing software systems efficiently. From structure diagrams like Class and Component diagrams to behavioral diagrams like Use Case and Sequence diagrams, each serves a unique purpose in system modeling. For seamless and accurate UML diagram creation, AssignmentGPT AI UML AI Generator is the best tool, making the process effortless and efficient.
FAQs
1. What is the most commonly used UML diagram type?
2. How do UML diagrams help in the software development process?
3. Can UML diagrams be used for non-software systems?
4. What's the difference between structure and behavioral diagrams?
5. Is it necessary to create all types of UML diagrams for every project?
Content writer at @AssignmentGPT
Kandarp’s world is powered by conversations, content, and creativity. With experience across branding, literature, publishing, and strategy, he has helped shape identities and stories for businesses across industries. At AssignmentGPT AI, he leads a team that blends sharp content, strong design, and local insight to turn businesses into brands that connect with people.
Master AI with
AssignmentGPT!
Get exclusive access to insider AI stories, tips and tricks. Sign up to the newsletter and be in the know!

Transform Your Studies with the Power of AssignmentGPT
Empower your academic pursuits with tools to enhance your learning speed and optimize your productivity, enabling you to excel in your studies with greater ease.
Start Your Free Trial ➤Start your success story with Assignment GPT! 🌟 Let's soar! 🚀
Step into the future of writing with our AI-powered platform. Start your free trial today and revolutionize your productivity, saving over 20 hours weekly.
Try For FREE ➤


