AssignmentGPT Blogs
ER diagrams do something similar but for data in databases, making complex systems much easier to understand. Entity-Relationship (ER) diagrams are pivotal in database design, providing a visual exposition of data structures. These diagrams facilitate the conceptualization and communication of database architectures by visually mapping out entities, attributes, relationships, and cardinalities. Utilizing distinct ER diagram symbols such as rectangles, ovals, and diamonds, ER diagrams make complex database schemas accessible and understandable. They support diverse notational systems, each tailored to enhance clarity and precision in data modeling, from UML to Chen, adapting to various design preferences and technical requirements.
Quick Summary
An ER diagram permits one to describe, on paper, the structure of a database by identifying entities, their attributes, and relationships. These diagrams allow one to understand and design database schemas through various ER symbols: rectangles for entities, ovals for attributes, and diamonds for relationships. Cardinality is indicated by such symbols as crow's feet, which specify how many instances of an entity relate to another. ER diagrams also use notations like UML, Crow's Foot, and Chen. All of them express different methodological perspectives in database design: either it is keys, data flow, or simplicity-oriented.
What is an ER Diagram?
An Entity–Relationship Diagram is a graphical means for describing the structure of data in a database. It can, therefore, be visibly defined with entities, their respective attributes, and the different connections between various entities that give an upper hand when coming up with database schema designs or when analyzing them.
What are the notations in an ER diagram?
Chen's notation for entity-relationship modeling uses rectangles to depict entity sets and diamonds to represent relationships, which can have their own attributes and relationships as first-class objects. A line connects an entity set to a relationship set to show participation.
What is UML notation in an ER diagram?
UML, or Unified Modeling Language, is a standardized collection of notations, shapes, and symbols that describe a software system’s components, their attributes, and their relationships.
Also read this article : Entity Relationship Diagrams in DBMS
In ER Diagrams, what Are the Symbols?
Symbols in ER diagrams represent the components of a database system as follows:
Rectangles represent entities : an entity is a something in the real world, such as an object or a concept, that is relevant to the problem being solved. Examples include entities like "Customer" or "Order".
Ovals represent attributes or characteristics of an entity. An oval is attached to the entity to which it corresponds.
Diamonds represent relationships - how the entities seem to be related.
Lines attached to diamonds associate the diamonds with the related entities. These lines often contain symbols, such as crow's feet or dots, in order to denote the cardinality and describe how many instances of one entity relate to another. This symbolic language is useful in the effective design and understanding of database structures.
Types of ER Diagram Symbols
The fundamental entity relationship diagram symbols used in ER diagrams, including entities, attributes, relationships, cardinality, and primary keys, are each represented by distinct graphical icons.Each ER symbol has a different role in depicting entities, relationships, attributes, and cardinalities in system design. Their types and meanings are detailed below:
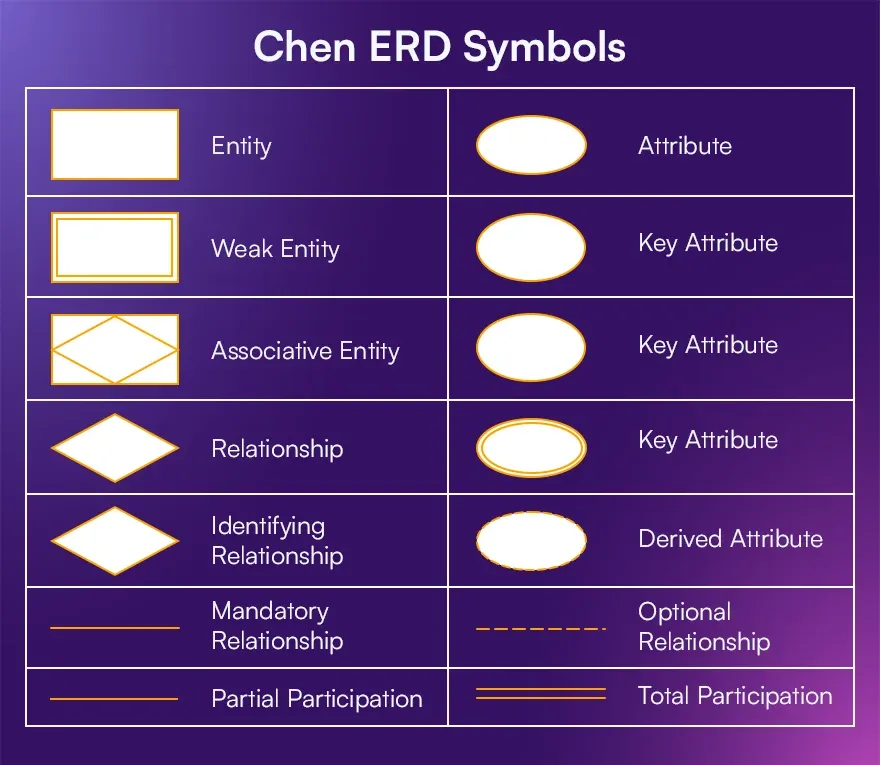
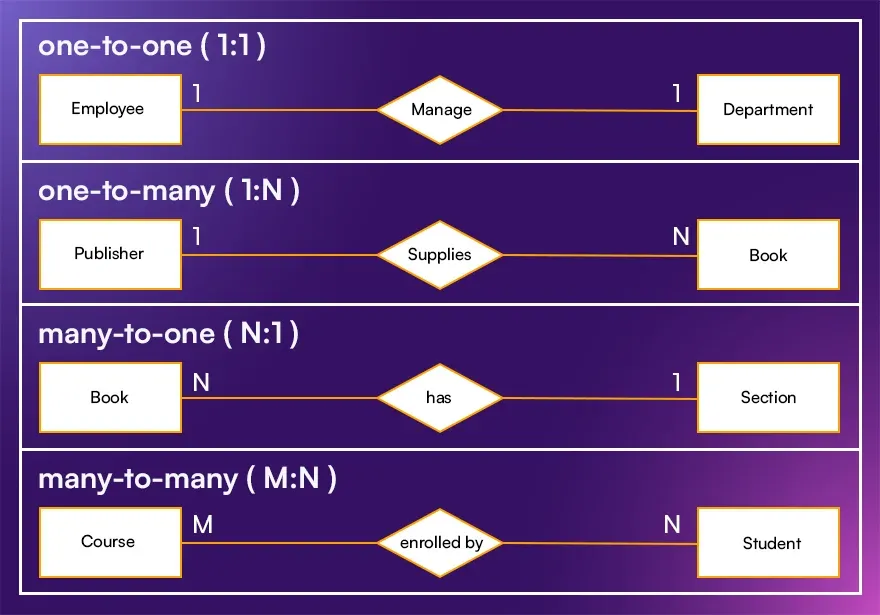
Chen ERD Symbols
- Utilize rectangles to depict entities, diamonds for relationships, and ovals for attributes, defining a clear visual language for database structures.
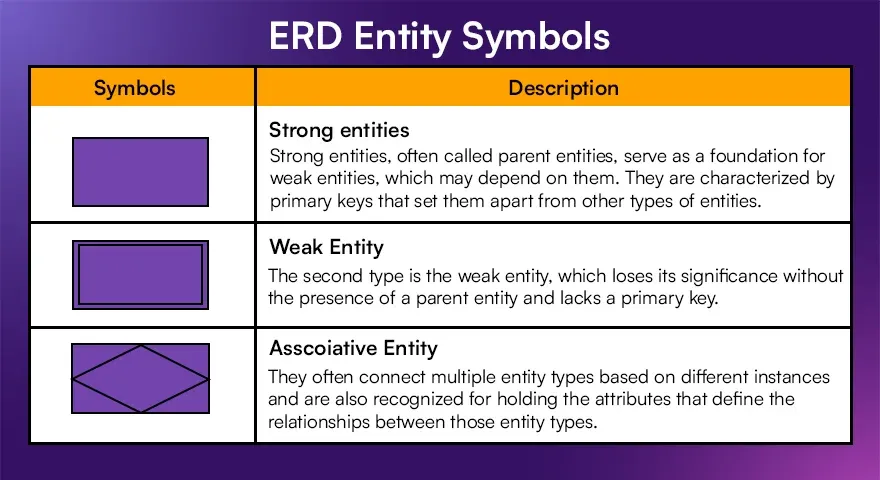
ERD Entity Symbols
- Rectangles symbolize entities, which are fundamental objects or concepts that hold data.
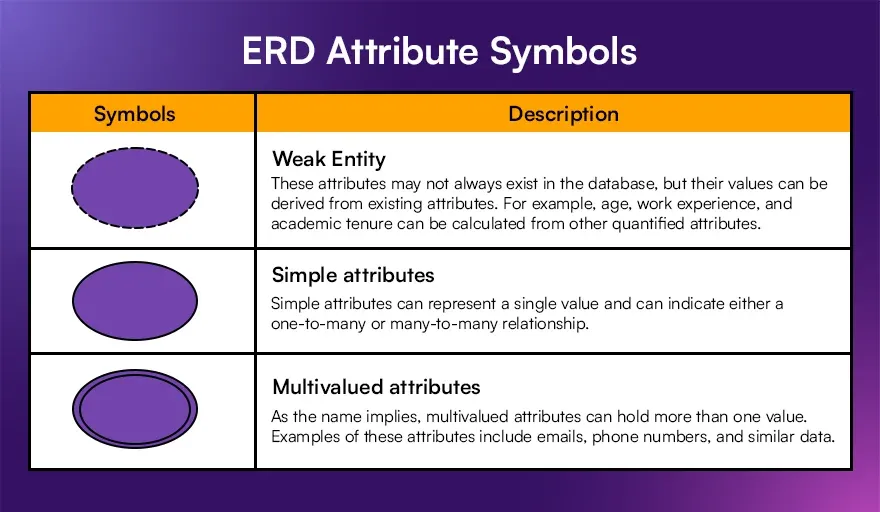
ERD Attribute Symbols
- Ovals, attached to entities, represent their attributes, indicating qualities or characteristics of these entities.
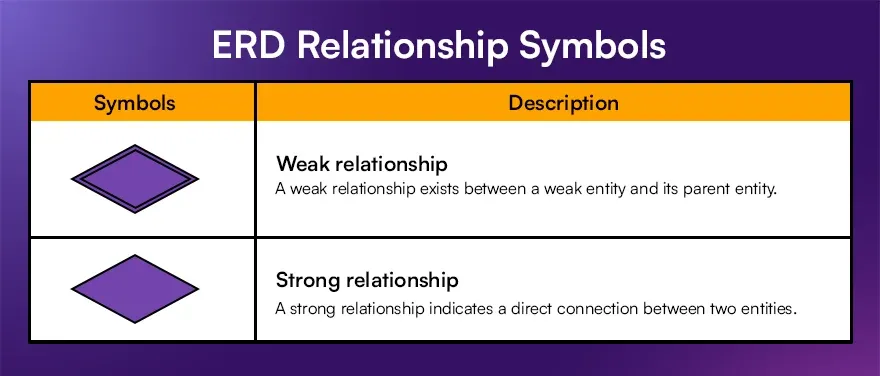
ERD Relationship Symbols
- Diamonds connect entities, visually representing the relationships between them.
Struggling to visualize your database? Want to simplify your ER diagram creation? Mastering ER diagram symbols is key, but doing it manually can be tedious. Use AssignmentGPT's Diagram Generator to quickly and accurately create professional ER diagrams. Input your data, and get a perfect diagram in seconds!
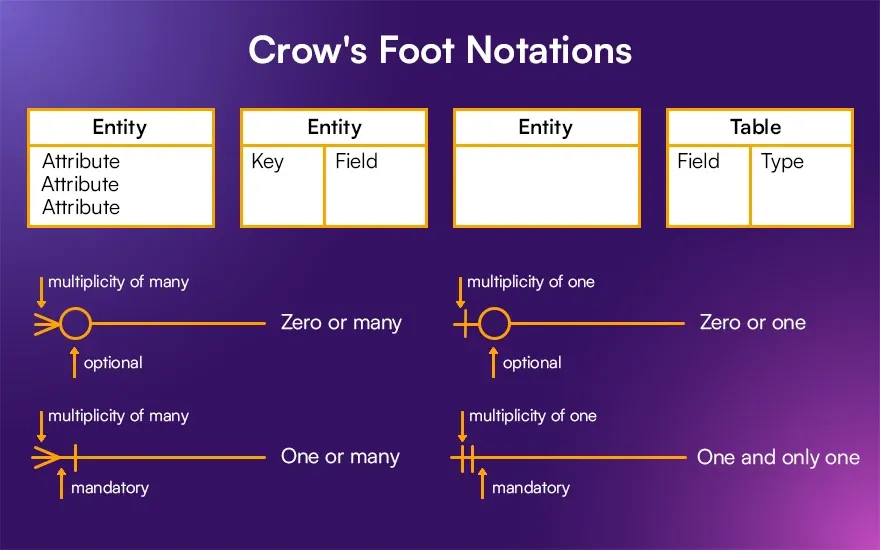
Crow's Foot Notations
Lines with crow’s feet or other markers show the nature of relationships, particularly the cardinality, or the number of instances that relate entities to each other.
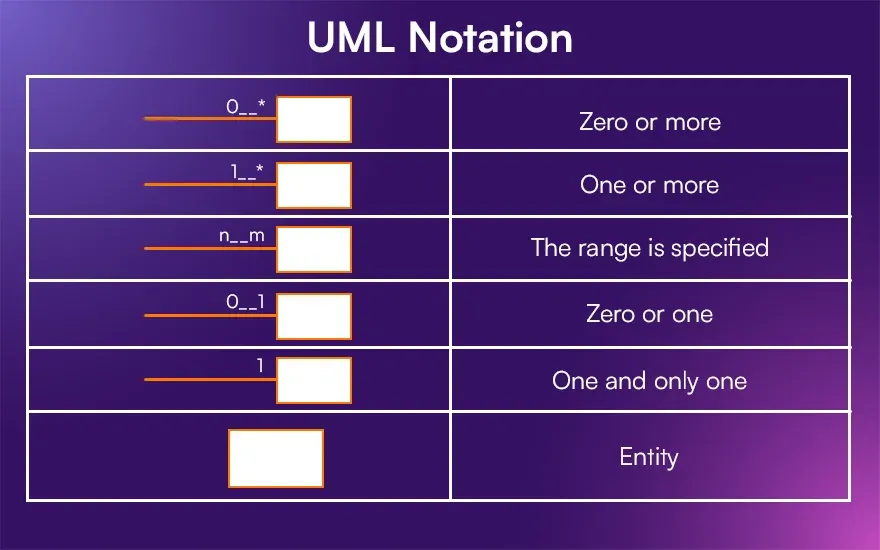
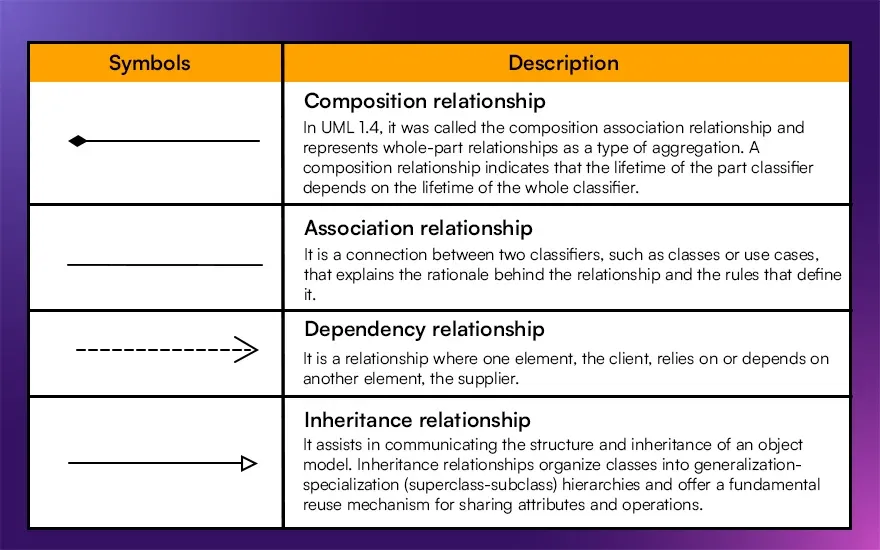
UML Notation
- Employs classes and associations to model entities and their relationships, adhering to the UML standard.
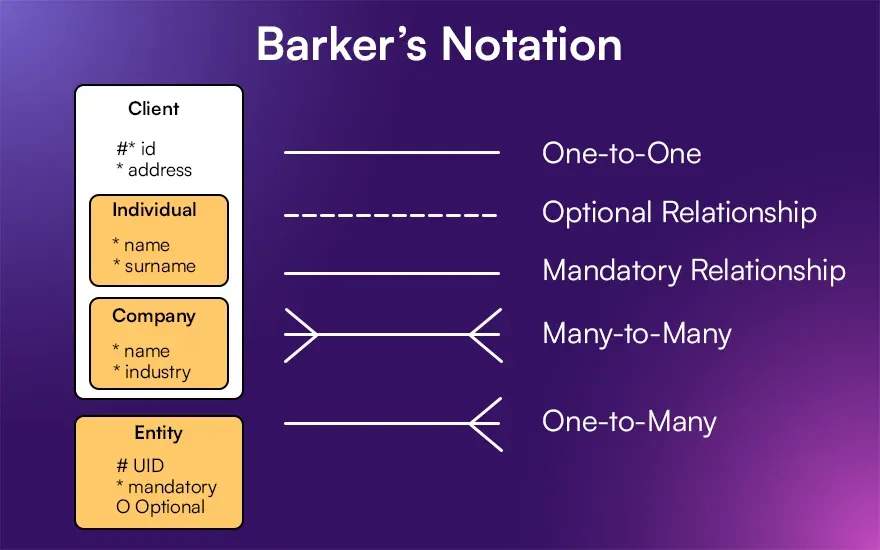
Barker’s Notation
- Focuses on simplicity, using boxes and lines with minimal symbols to denote cardinality and relationships.
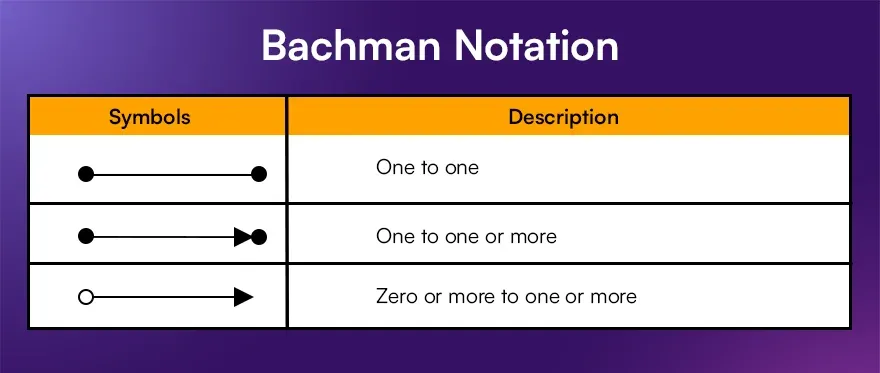
Bachman Notation
- Centers on data architecture, utilizing specific symbols tailored for data processing environments.
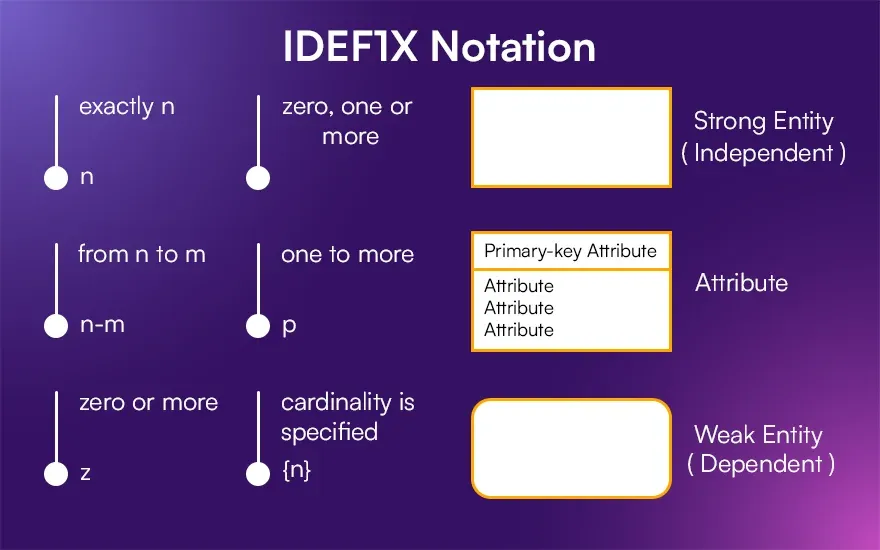
IDEF1X Notation
- A methodology featuring rectangles for entities, ovals for attributes, and lines for relationships, highlighting keys and their connections.
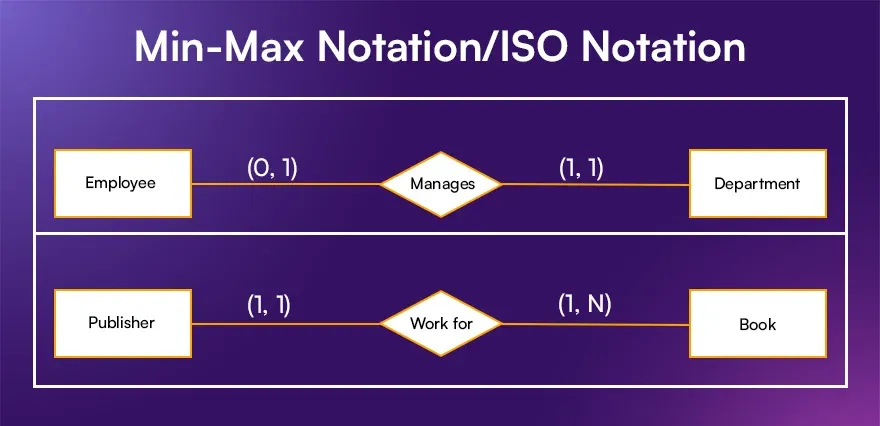
Min-Max Notation/ISO Notation
- Clarifies the minimum and maximum cardinalities within relationships, providing precise constraints.
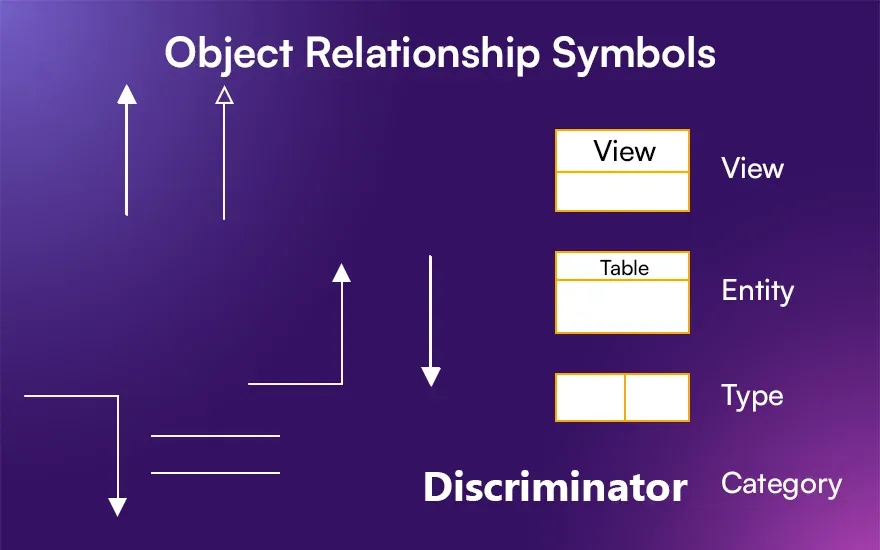
Object Relationship Symbols
- Used in object-oriented models, these are similar to UML but tailored for simpler designs.
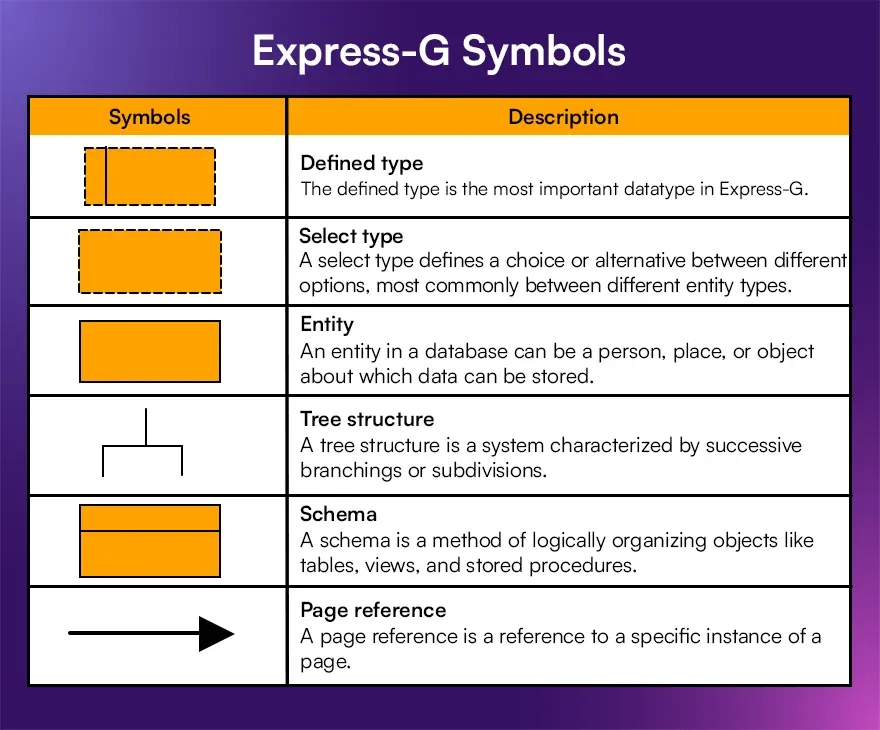
Express-G Symbols
- A graphical notation of ER diagrams that are part of the EXPRESS language, used for detailed data modeling.
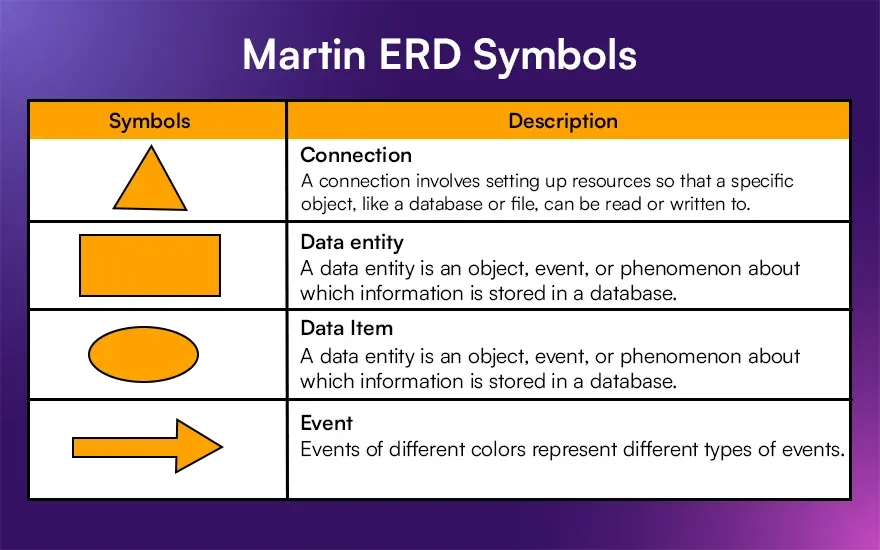
Martin ERD Symbols
- Incorporates rectangles, ovals, and arrows to emphasize data flow within the system.
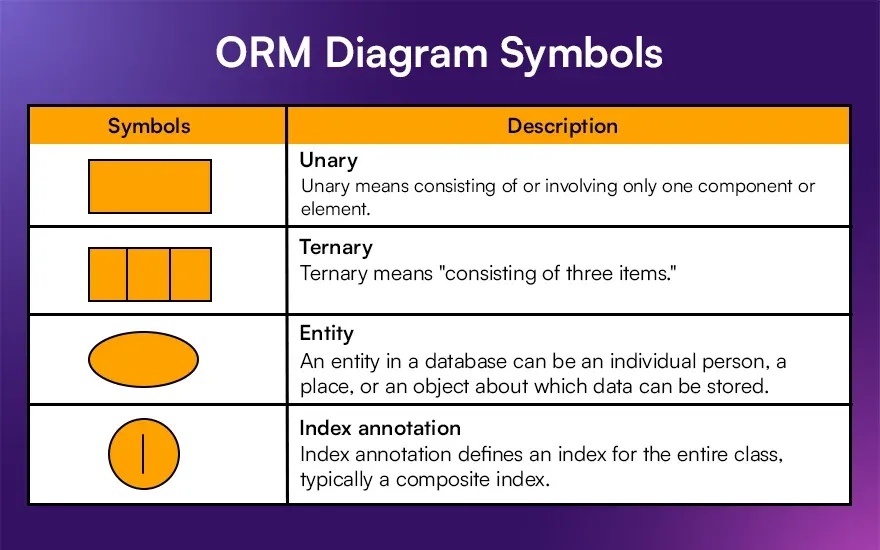
ORM Diagram Symbols
- Object-role modeling uses various shapes to represent both roles and entities, focusing on the semantics of the data model.
Struggling to draw or understand ER diagrams? Let AI simplify your homework! Instantly generate ER diagrams or get step-by-step help for any assignment with our AI Homework Helper.
Conclusion
ER diagrams are invaluable tools in the field of database management, allowing designers and analysts to lay out and refine data interactions and structures effectively. The myriad entity relationship diagram symbols and notations used, from Chen to ORM, cater to different facets of database design, ensuring flexibility and depth in modeling. Understanding these symbols and their applications not only aids in building robust databases but also ensures that they are scalable and adaptable to changing data needs. As technology evolves, the precision and variety of these symbols continue to advance, underpinning the ongoing development and optimization of database systems.
AssignmentGPT AI is a much better option for academic tasks as it provides all the important academic tools such as a math solver and diagram maker it provides complete solutions for academic tasks.
FAQs
1. What are ER Diagrams used for?
2. How do ER diagram symbols help in database design?
3. What are some common notations for ER diagrams?
4. What are UML symbols?
5. Which 2 are symbols for UML use case model?
6. What are the two main types of UML diagrams?
Content writer at @AssignmentGPT
Kandarp’s world is powered by conversations, content, and creativity. With experience across branding, literature, publishing, and strategy, he has helped shape identities and stories for businesses across industries. At AssignmentGPT AI, he leads a team that blends sharp content, strong design, and local insight to turn businesses into brands that connect with people.
Master AI with
AssignmentGPT!
Get exclusive access to insider AI stories, tips and tricks. Sign up to the newsletter and be in the know!

Transform Your Studies with the Power of AssignmentGPT
Empower your academic pursuits with tools to enhance your learning speed and optimize your productivity, enabling you to excel in your studies with greater ease.
Start Your Free Trial ➤Start your success story with Assignment GPT! 🌟 Let's soar! 🚀
Step into the future of writing with our AI-powered platform. Start your free trial today and revolutionize your productivity, saving over 20 hours weekly.
Try For FREE ➤